<9. OPERATION OF ISC (Induvtive Conductivity)>
9-10
IM 12A01A02-01E
8th Edition : Oct. 01, 2015-00
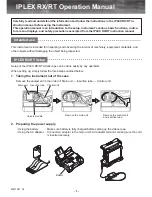
The screen displays the trend of up to 41 averages of the measurement for each time interval.
The FLXA202/FLXA21 samples the measurements every second. The trending graphic also
shows the maximum and minimum measured values in that interval.
For example, if the time scale is set to 4 hours, then the trend is shown for 4 hours prior to the
actual measurement. Each point on the trend line represents the average over 4×60×60/41 =
351 measurements (seconds).
NOTE
Updating the trend screen setup resets the current trend graph and starts a new one.
12.00
8.40
5.60
2.50
12:00
12:20
12:40
10.38mS/cm
Minimum
Maximum
Average
Time
Tag:
Measurement value (
mS/cm)
ISC
Conduct1-TC1
Current process value
Max. and min. values on this display
Figure 9.8
Trend screen
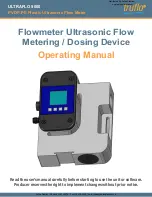
The 1st display item data on the Main display is shown as a graph. Touching any point on the
display changes the display to the 2nd display item data (and to the 3rd display item data if set)
and then returns to the Main display.
12.00
8.40
5.60
2.50
12:00
12:20
12:40
10.38mS/cm
Tag: ISC
Conduct1-TC1
12.00
8.40
5.60
2.50
12:00
12:20
12:40
25.0°C
Tag: ISC
Temperature1
Next
20
12
4
mA
15.00
Figure 9.9
Trend graphics
Содержание FLXA202
Страница 1: ...User s Manual Model FLXA202 FLXA21 2 Wire Analyzer IM 12A01A02 01E IM 12A01A02 01E 8th Edition ...
Страница 270: ......
Страница 272: ......
Страница 274: ......