2-29
IM 701310-01E
Explanation of Functions
3
2
1
4
5
6
7
8
9
10
11
12
13
14
15
16
17
18
19
App
Index
The following formulas are used to calculate each item.
Vtop – Vbase
T crossing2 – Tcrossing1
Crossing% = 100
Duty Cycle Distortion% = 100
EyeHeight = (Vtop - 3
σ
top) – (Vbase + 3
σ
base)
EyeWidth = (T crossing2 – 3
σ
crossing2) – (Tcro 3
σ
crossing1)
Jitter =
σ crossing1
QFactor =
ExtRatedB = 10log
V crossing – V base
Vtop – Vbase
Trising50% – Tfalling50%
σ
top +
σ
base
Vtop – Vdark
Vbase – Vdark
X-Y
Analysis ►For the procedure, see section 10.6
With one signal level applied to the X-axis (horizontal axis), and a second signal level
applied to the Y-axis (vertical axis), the phase relationship between the two input
signals can be observed. Simultaneous observation of X-Y waveforms and normal T-Y
waveforms (waveform display using time axis and level) is possible.
It is also possible to specify the ranges for X-Y analysis, or carry out analysis depending
on the specified signal level.
The X-Y analysis results can be used for cursor measurement, and also the area can
be computed. For details of the computation of area, see Appendix 2, “Waveform Area
Computation.”
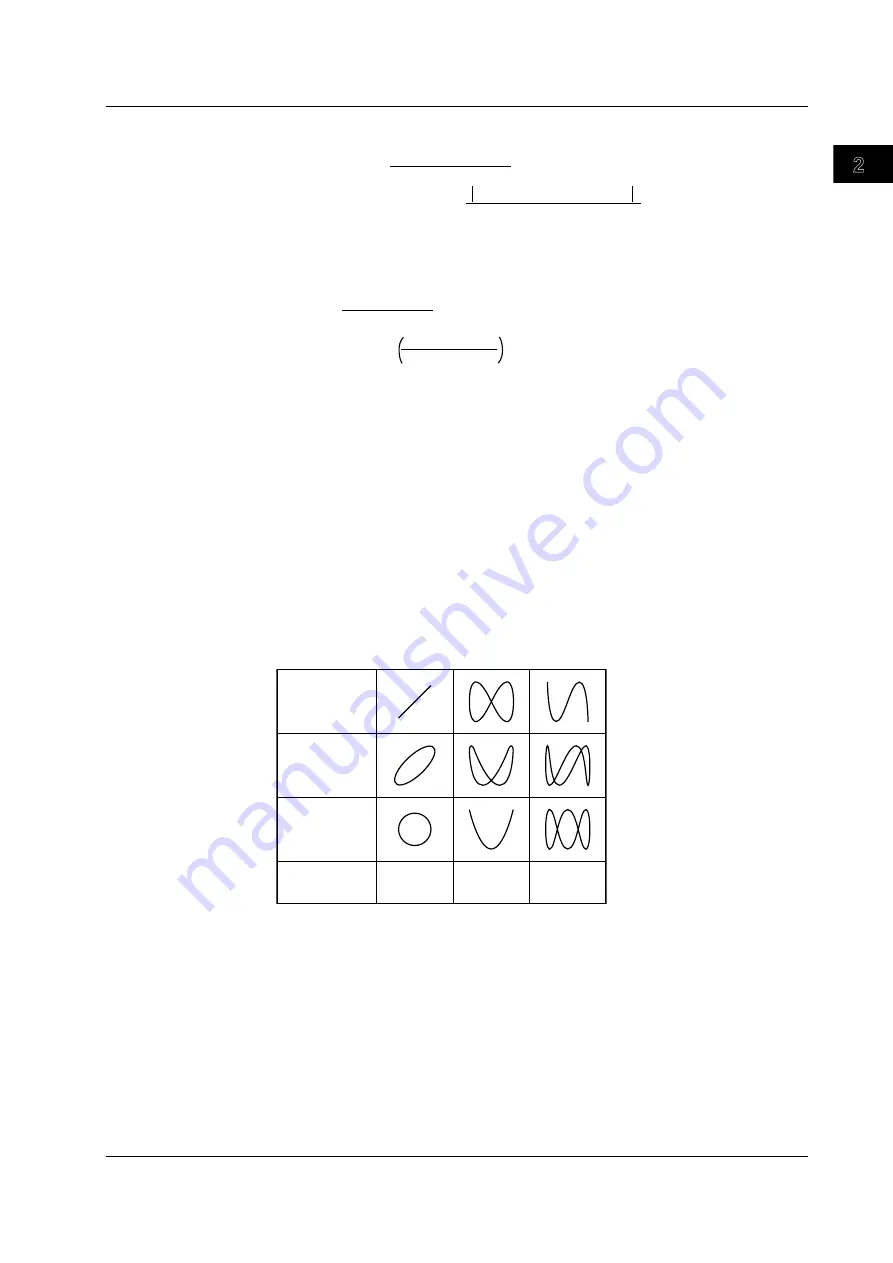
You can use the X-Y waveform display function to measure the phase angle between two
sine wave signals. For example, an X-Y display of two sine waves produces a so-called
Lissajous figure, from which the phase angle can be read.
Phase angle 0°
Phase angle 45°
Phase angle 90°
Frequency ratio
(X : Y)
1 : 1
1 : 2
1 : 3
Lissajous waveform
2.8 Analyzing and Searching


