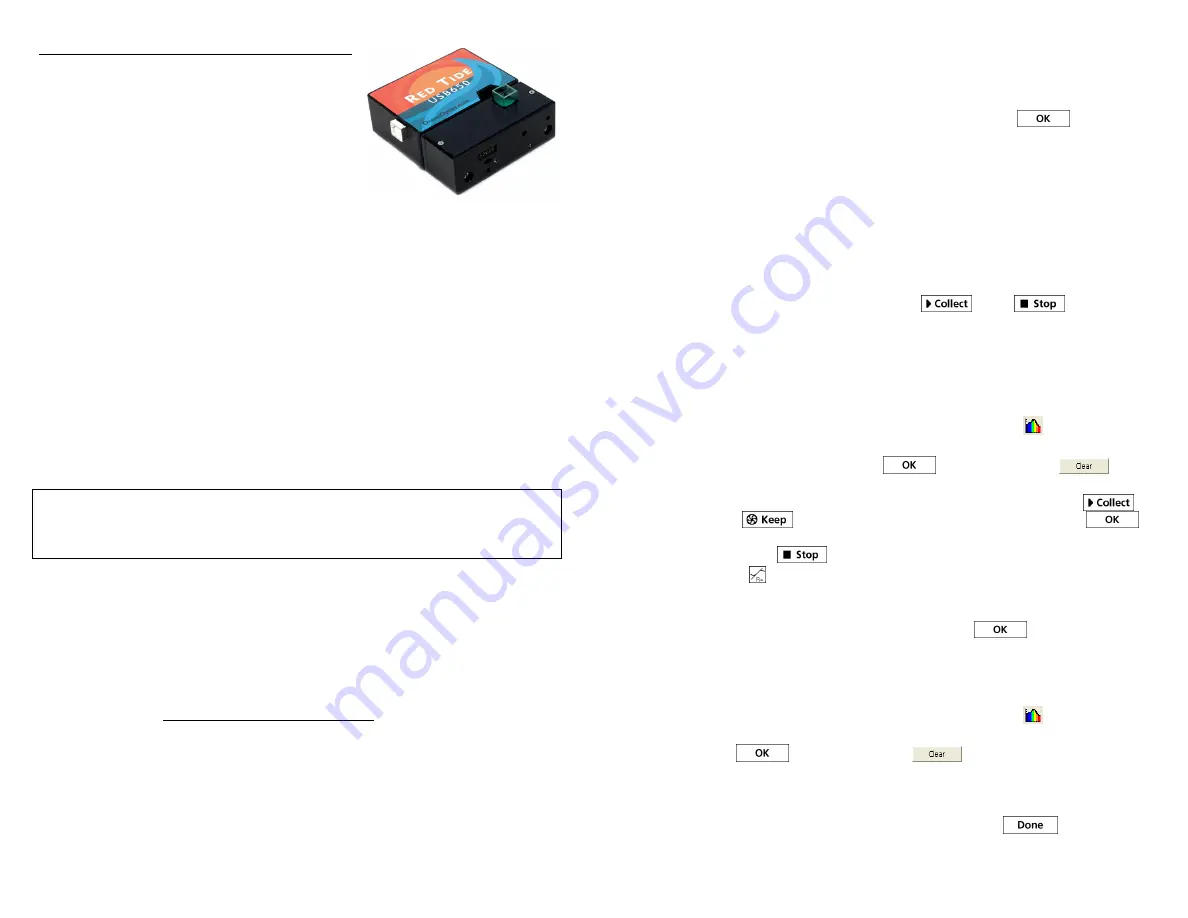
Vernier Spectrometer
Ocean Optics Red Tide
Spectrometer
(Order Codes: V-SPEC, SPRT-VIS)
These spectrometers are portable light
spectrophotometers, combining a spectrometer and a light source/cuvette holder. The
light source/cuvette holder may be detached and an optical fiber assembly attached
to the spectrometer for emission spectrum experiments.
What is included with the Spectrometer?
One spectrometer with light source/cuvette holder (Vernier Spectrometer, Ocean
Optics™ Red Tide Spectrometer)
One package of 15 plastic cuvettes and lids
One USB cable
Software Requirements
Logger
Pro
®
3 (version 3.8.5 or newer) software is required. If you own a previous
version of Logger
Pro
3, you may upgrade the software free of charge. You need the
LabQuest
®
application version 1.1 or newer to use a LabQuest 2 or original
LabQuest as a standalone device with a spectrometer. Visit
http://www.vernier.com/LabQuest/updates
NOTE:
Vernier products are designed for educational use. Our products are not
designed nor recommended for any industrial, medical, or commercial process such
as life support, patient diagnosis, control of a manufacturing process, or industrial
testing of any kind.
Get Started
Using a Spectrometer with Your Computer
1. Install Logger
Pro
3 software (version 3.8.5 or newer) on your computer before
using an Ocean Optics spectrometer.
2. Connect the spectrometer to a powered USB port or a powered hub. Allow the
spectrometer to warm up for a few minutes.
3. The first time you connect a spectrometer, your computer may ask you a few
questions.
Note:
Do not go online for device drivers. The device drivers were
installed when you installed Logger
Pro
3.
Windows computers (Windows XP or Vista) Follow the New Hardware Wizard
instructions to download the drivers automatically.
Macintosh computers (Mac OS 10.3 or newer) If it appears, follow the New
Device instructions.
2
Calibrate the Spectrometer for Measuring Absorbance or %T
With the spectrometer connected to your computer and Logger
Pro
3 running,
choose Calibrate
►
Spectrometer from the Experiment menu. Follow the
instructions in the dialog box to complete the calibration. Click
.
Collect Data
There are three general types of data collection measuring absorbance – absorbance
vs.
wavelength which produces a spectrum, absorbance
vs
. concentration for Beer’s
law experiments, and absorbance
vs.
time for kinetics experiments.
Measure the Absorbance Spectrum of an Aqueous Sample
(Absorbance
vs
. Wavelength)
1. Calibrate the spectrometer as described above.
2. Fill a cuvette about ¾ full of the solution to be tested. Place the sample in the
cuvette holder of the spectrometer and click
. Click
to end the
data collection.
3. To store the spectrum data, choose Store Latest Run from the Experiment menu.
Conduct a Beer’s Law Experiment (Absorbance
vs
.
Concentration)
1. Measure an absorbance spectrum as described above.
2. Click on the Configure Spectrometer Data Collection button,
.
3. Click Abs
vs
. Concentration. The wavelength of the maximum absorbance will be
automatically selected (
max). Click
to continue or click
and
select a wavelength on the graph or in the list of wavelengths.
4. Place your first Beer’s law standard solution in the spectrometer. Click
and then click
. Enter the concentration of the sample and click
.
Repeat this step for the remaining standard samples. After you have tested the
final standard, click
to end the data collection.
5. Click linear fit, , to see the function for the standard solutions.
6. Place an unknown sample of solution in the spectrometer. Choose Interpolation
Calculator from the Analyze menu. A helper box will appear, displaying the
absorbance and concentration of the unknown. Click
.
Conduct a Kinetics Experiment (Absorbance
vs
. Time)
1. Measure an absorbance spectrum as described above. If you wish to store the
data, select Store Latest Run from the Experiment menu.
2. Click on the Configure Spectrometer Data Collection button,
.
3. Click Abs
vs
. Time. The wavelength of maximum absorbance will be selected as
before. Click
to continue or click
and select a wavelength on
the graph or in the list of wavelengths.
4. The default settings are 1 sample per second for 200 seconds. To change the
data-collection parameters for your experiment, choose Data Collection from the
Experiment menu and make the necessary changes. Click
.


