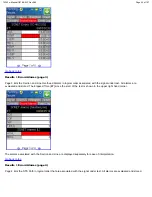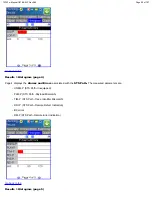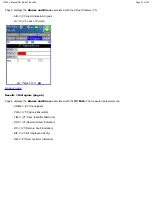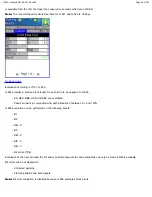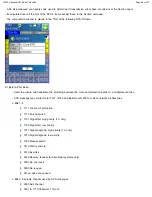
Results > Histogram (page 9)
Page 9 displays the
Errors
associated with the test pattern.
8.2.6 Results > Graph
The Graph tab brings up the screen displaying a log of the Errors recorded during the measurement interval. A dedicated page
is available for each of the following error types;
- FAS
- B1
- B2
- REI -S
TX150 e-Manual D07-00-023 Rev A02
Page 53 of 107


