Single Scan Operation
4-11
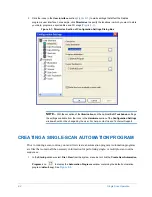
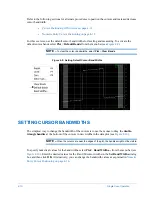
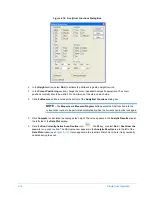
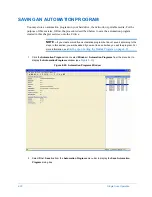
Figure 4-10: Setting Cursor Band Widths: Handle and Dialog Box
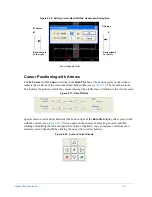
Cursor Positioning with Arrows
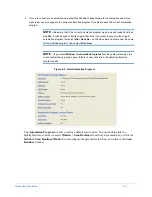
The
R. Cursor
and
M. Cursor
sections in the
Data Plot
box at the bottom center of the window
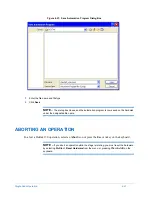
indicate the locations of the cursors and their bandwidths (see
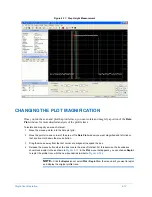
). The Å numbers in the
box indicate the points at which the cursors intercept the profile trace in relation to the vertical scale.
Figure 4-11: Data Plot Box
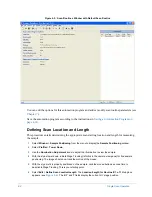
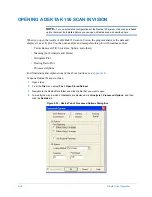
Special cursor-control arrow buttons at the bottom-right of the
Data Plot
display allow you to work
with the cursors (see
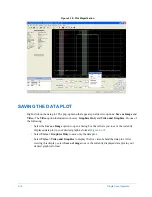
). You can position the cursors by selecting a cursor, and then
clicking and holding the left and right arrow buttons. Similarly, you can increase or decrease the
selected cursor’s bandwidth by clicking the up and down arrow buttons.
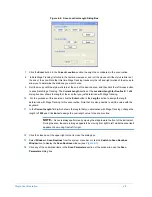
Figure 4-12: Cursor-Control Arrows
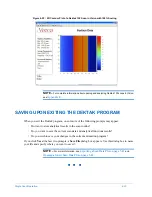
R Cursor Bandwidth Handle
R Cursor
R
Band width is
to the left.
M Cursor
M
Band width is
to the right.
Содержание Dektak 150
Страница 1: ......
Страница 2: ...P N 980 294 Standard P N 980 298 Cleanroom Revision A DEKTAK 150 SURFACE PROFILER USER S MANUAL ...
Страница 7: ......
Страница 17: ......
Страница 81: ......
Страница 105: ......
Страница 149: ......
Страница 191: ......
Страница 251: ......
Страница 257: ...A 6 Facilities Specifications Figure A 6 Dektak 150 without Enclosure Side View ...
Страница 258: ...Facilities Specifications A 7 Figure A 7 Dektak 150 Dimensions without Enclosure Top View ...
Страница 259: ...A 8 Facilities Specifications Figure A 8 Dektak 150 without Enclosure Center of Mass ...
Страница 273: ......
Страница 283: ......
Страница 320: ...3D Mapping Function E 37 Figure E 26 Database Options Button Figure E 27 Database Options Dialog Box ...
Страница 321: ......
Страница 331: ......
Страница 333: ......
Страница 336: ......
Страница 337: ......
Страница 349: ......

