WELD SENTRY 2
Page 19
(4)
Press [CHNG] to change END to a right arrow and add Program B which is a copy of Program A.
Program A will be used to monitor one measurement unit and Program B will be used to monitor
another.
(5)
Move the arrow to 00lB and press [PROG] to display the Schedule program screen shown at the
right.
(6)
Program B should be displayed at the right under Program 001. Move the cursor to the "A" and
press [CHNG] to display 'B'.
(7)
Move the cursor underneath "Results" and use [CHNG] to change to a different measurement unit.
(8)
Press [SAVE] to save the new Schedule with Programs A and B.
(9)
Repeat steps #2 - 8 to add additional Programs C, D and E.
DISPLAY GRAPH OF LAST WELD
Every time a weld is monitored, the graphic information is held in memory until another weld is
made.
(1)
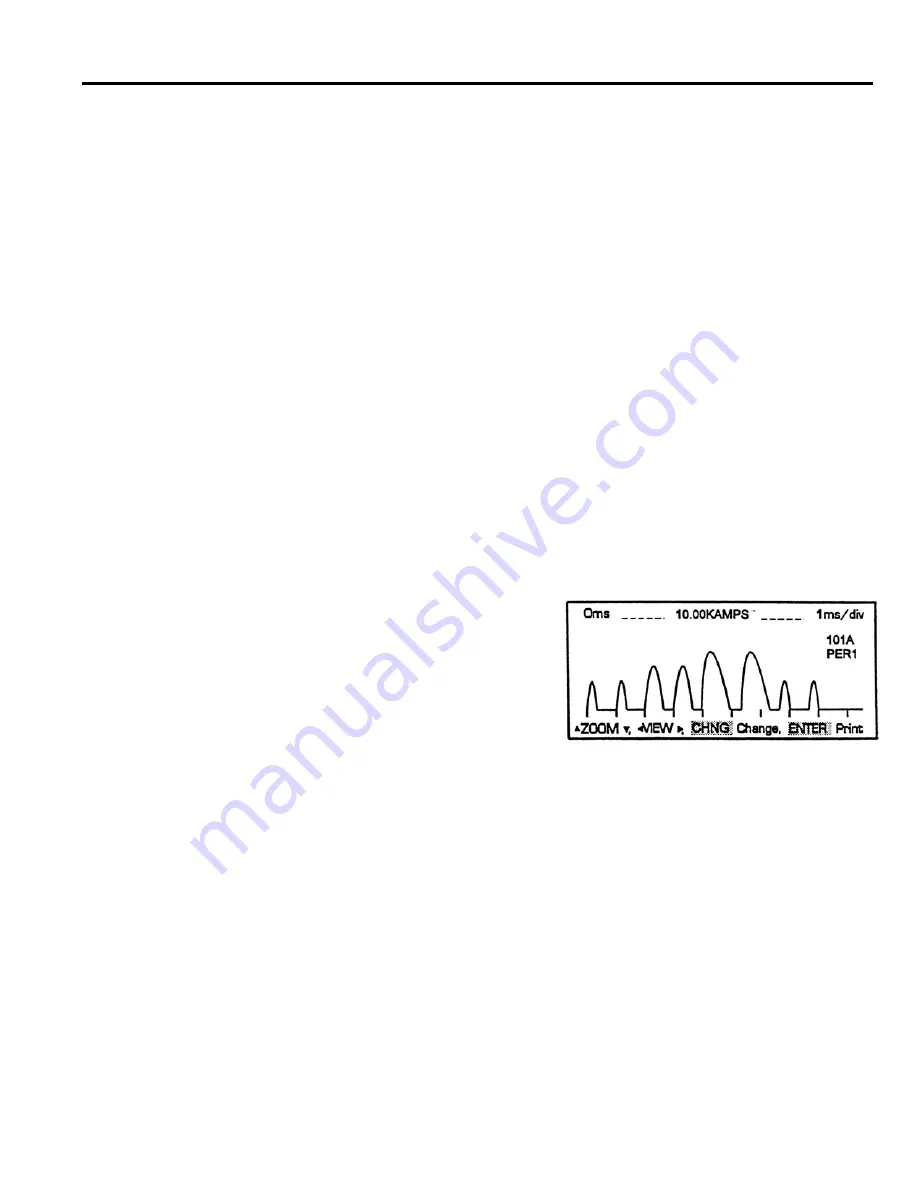
Press [MENU] and move the cursor to Display Graph. The screen shown below will be displayed.
(2)
Press [CLING] to display each of the graphs available;
Amps, Volts, Ohms, Watts and Amps-Volts.
(3)
Press [ENTER] to print the displayed graph to a serial
printer.
(4)
Time divisions are marked across the bottom of the
graph, the milliseconds per division is shown at the upper right, lms/div.
(5) Press
▲
/
▼
to change the time divisions for a larger or smaller graph size.
(6) Press
◄
/
►
to move the graph to the left or right to view a lengthy graph.
(7)
The maximum scale of the graph is shown at the top, 10.00KAMPS, (determined by Gain Setting).
The Program number, 101A, and the Period number, PER1, are shown at the right.
Содержание 3-131-XX
Страница 5: ......


