EX-91191 User Manual
33
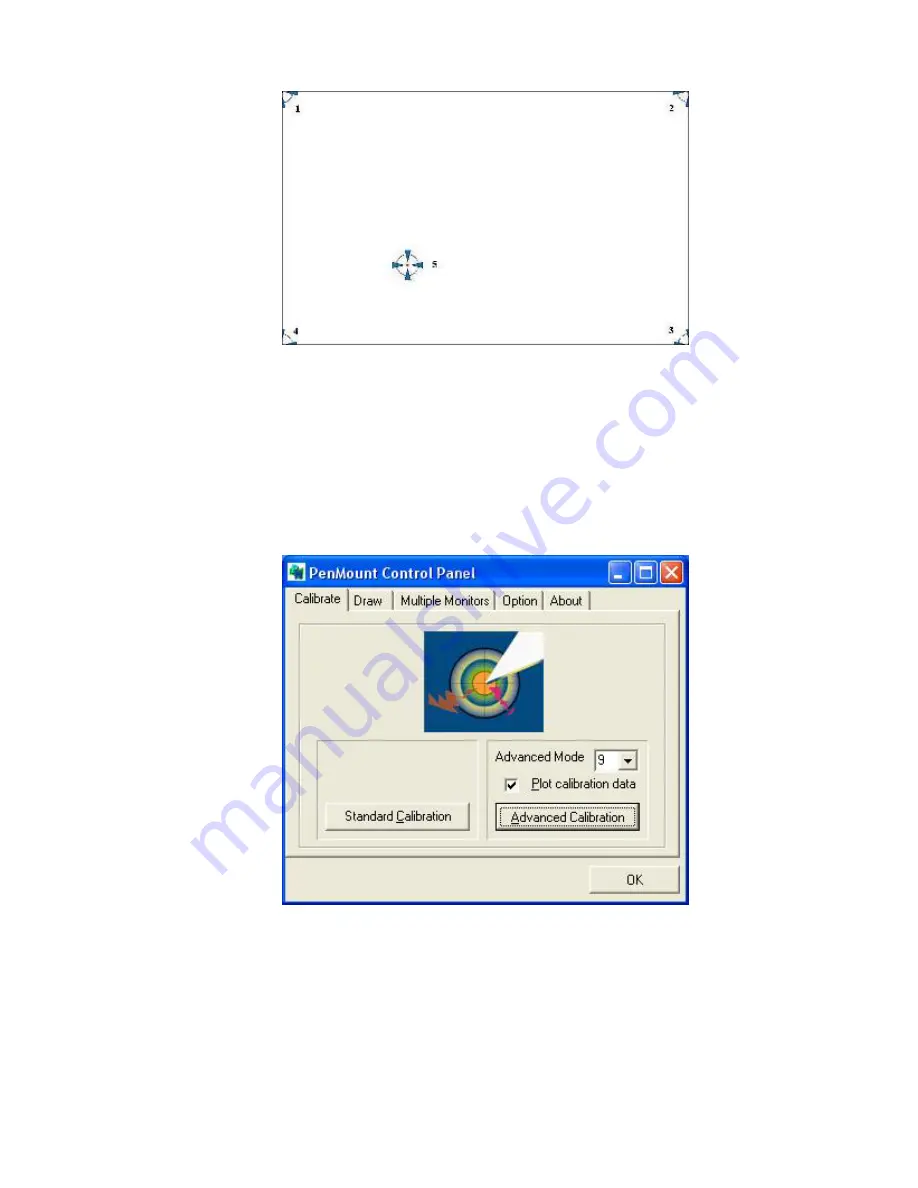
Plot Calibration Data
Check this function and a touch panel linearity
comparison graph appears when you have
finished Advanced Calibration. The blue lines
show linearity before calibration and black
lines show linearity after calibration.


