


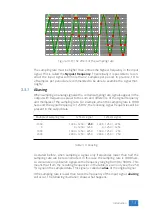


Figure 3.8: Sampling
The sine wave in figure
is sampled at the dot positions. By connecting the
adjacent samples, the original signal can be reconstructed from the samples. You
can see the result in figure
.
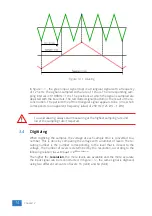
Figure 3.9: ”connecting” the samples
3.3
Sampling rate
The rate at which the samples are taken is called the
sampling rate
, the number
of samples per second. A higher sampling rate corresponds to a shorter interval
between the samples. As is visible in figure
, with a higher sampling rate, the
original signal can be reconstructed much better from the measured samples.
12
Chapter 3
Содержание Handyscope HS6 DIFF Series
Страница 1: ...Handyscope HS6 DIFF User manual TiePie engineering...
Страница 6: ......
Страница 21: ...Figure 3 15 over compensated Introduction 17...
Страница 22: ...18 Chapter 3...
Страница 25: ...Figure 4 3 Driver install Finished Driver installation 21...
Страница 26: ...22 Chapter 4...
Страница 32: ...28 Chapter 7...
Страница 44: ...TiePie engineering Handyscope HS6 DIFF instrument manual revision 2 27 February 2020...