Parametric Graphing
333
Parametric Graphing
Overview of Steps in Graphing Parametric
Equations
To graph parametric equations, use the same general steps used for
y(x)
functions as
described in
Basic Function Graphing
. Any differences that apply to parametric
equations are described on the following pages.
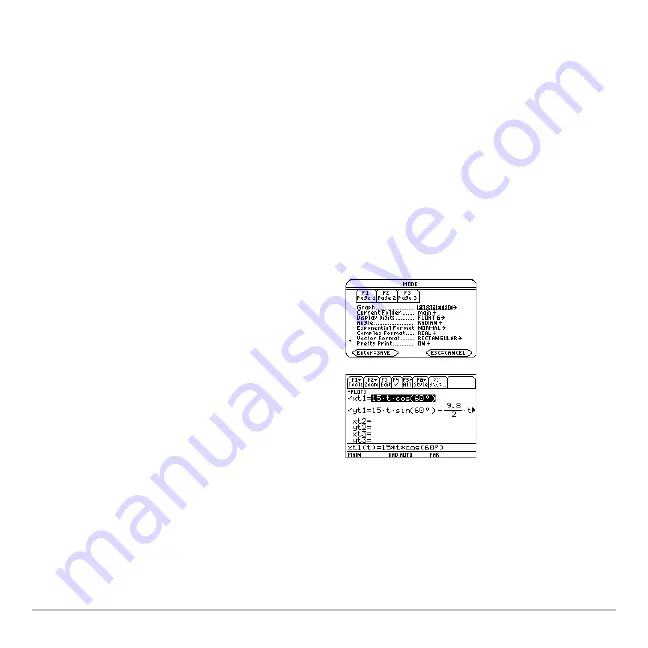
Graping Parametic Equations
1. Set
Graph
mode (
3
) to
PARAMETRIC
.
Also set
Angle
mode, if necessary.
2. Define x and y components on Y= Editor
(
8 #
).
3. Select (
†
), which defined equations to
graph. Select the x or y component, or
both.
Note:
To turn off any stat data plots, press
‡
5
or use
†
to deselect them.
Содержание Titanium TI-89
Страница 9: ...Getting Started 6 TI 89 Titanium keys Ë Ì Í Ê ...
Страница 34: ...Getting Started 31 2 or D 2 B u s i n e s s D B D B Press Result ...
Страница 43: ...Getting Started 40 3 0 D B D D B D Press Result ...
Страница 44: ...Getting Started 41 D 2 0 0 2 D B Scroll down to October and press Press Result ...
Страница 58: ...Getting Started 55 Example Set split screen mode to TOP BOTTOM Press Result 3 B D ...
Страница 70: ...Getting Started 67 ...
Страница 175: ...Operating the Calculator 172 From the Keyboard ...
Страница 456: ...Tables 453 ...
Страница 503: ...Split Screens 500 Note Both Top Bottom and Left Right splits use the same methods to select an application ...
Страница 527: ...Data Matrix Editor 524 ...
Страница 704: ...Connectivity 701 A TI 89 Titanium and a Voyage 200 linked together I O Port I O Port I O unit to unit cable ...


