


42 Getting Started with TI InterActive!
TII_GettingStarted.doc Getting Started with TI InterActive! Karen Davis Revised: 6/15/04 2:00 PM Printed: 6/15/04 3:39 PM Page 42 of 63
When you extract Web data, TI InterActive! creates lists in the
List Editor and places the data in those lists.
1. Click the Select button at the top of the browser window. The
browser highlights the table of braking distance data.
2. Click the Extract button. The List Editor is displayed, with
the Web data copied to lists.
3. Click the Save To Document button
to insert the lists into
the document. Adjust the list screen to view all columns of
data.
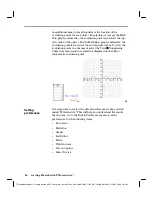
Now that you have the braking distance data copied into lists,
you can create a scatter plot of the speeds (x) against the total
stopping distances (y).
1. With the cursor positioned at the end of the list, press Enter on
the keyboard, type
Plotted data:
, and then press Enter again to
create a heading for the regression results.
2. On the TI InterActive! toolbar, click the down arrow
next
to the Graph button.
3. From the drop-down buttons, click Scatter Plot
. The
Functions editor is displayed.
Extracting the
data
TIP
: To select only
specific rows, drag
through the rows
instead of clicking the
Select button.
Note
: See page 53 for
details about resizing
objects.
Plotting the
braking
performance


