Copyright © 2017, Texas Instruments Incorporated
Eyescan Analysis
35
SLAU711 – March 2017
Copyright © 2017, Texas Instruments Incorporated
HSDC Pro With Xilinx
®
KCU105
8
Eyescan Analysis
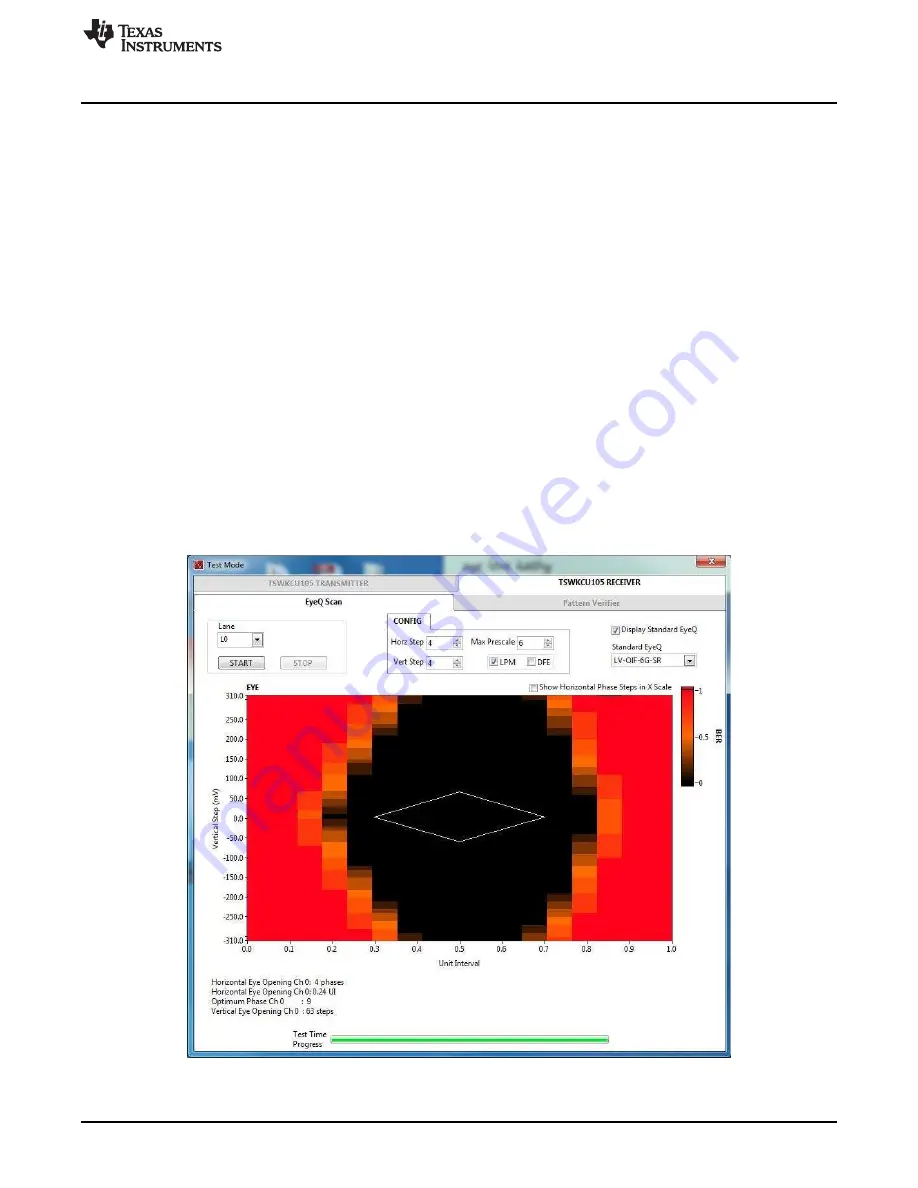
One of the features of the KCU105 is the ability to receive data and measure the horizontal and vertical
eye opening. This Eyescan feature is used as an diagnosis tool to debug the digital signals in each
enabled lane. The latest version of HSDC Pro supports this feature and generates an eye diagram
consisting of a bit error rate (BER) heat map.
The following section provides a quick start-up example that highlights the software features of the
Eyescan analysis.
1. Verify that the ADC EVM provides a good FFT capture on HSDC Pro.
2. In HSDC Pro, under the
Instrument Options
tab, click on
SERDES Test Options
.
3. A new window should appear with the following features:
(a)
Lane
- Selects one of the lanes to analyze (the lane number is respective to the KCU105)
(b)
Horz Step
- Resolution of the horizontal scan (For optimal resolution, choose 4 or lower)
(c)
Vert Step
- Resolution of the vertical scan (For optimal resolution, choose 4 or lower)
(d)
Max Prescale
- The amount of time spent at each vertical and horizontal sample (A higher value
will result in a finer BER)
(e)
LPM
,
DFE
- Specifies whether the transceiver is in LPM or DFE mode
(f)
Standard EyeQ
- Overlays one of the JESD204 receive eye-mask templates onto the Eye diagram
4. After configuring the parameters, click the
START
button. The scan may take a few seconds to a few
minutes, depending on the parameters chosen.
shows an eye diagram of a 8224 mode ADC32RF45EVM sampling at 2 GHz with a lane rate of
10 GHz.
Figure 34. Eye Diagram Example Plot


