Operation
www.ti.com
The bq Evaluation Software provides a logging function which logs the values that were last scanned by
EVSW. To enable this function, select the
Start Logging
button; this causes the
Keep Scanning
button to
be selected. When logging is
Stopped
, the keep scanning button is still selected and has to be manually
unchecked.
The logging intervals are specified under the | Options | menu with the maximum value of 65535 ms. The
Log
interval cannot be smaller than the scan interval because this results in the same value being logged
at least twice.
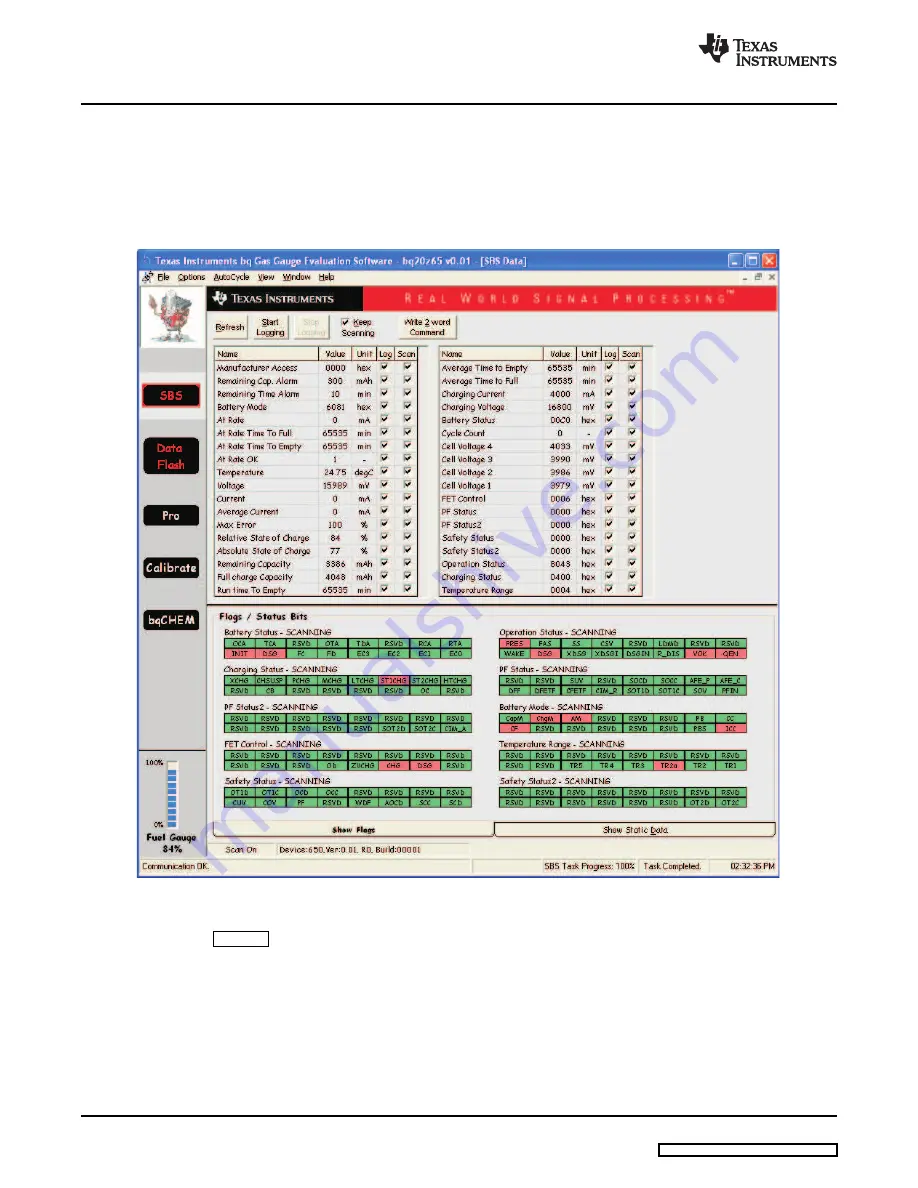
Figure 8. SBS Data Screen
This screen (
) shows the SBS data set along with additional ManufacturersAccess() command
information such as individual cell measurements. Additional Flag and Static data can be viewed by
selecting the appropriate tab at the bottom of the SBS screen.
Data such as SBS.ManufacturerName() is static and does not change. This data is viewed separately
using the
Static Data
tab available at the bottom of the screen.
Dragging the splitter bar (line that separates the Flags/Static data from SBS values) changes the height of
the Flags/Static Data display. Selecting | View |, then | Auto Arrange | returns the splitter bar to its original
location.
10
bq20z65EVM-001 SBS 1.1 Impedance Track™ Technology
SLUU353 – June 2009
Enabled Battery Management Solution Evaluation Module


