


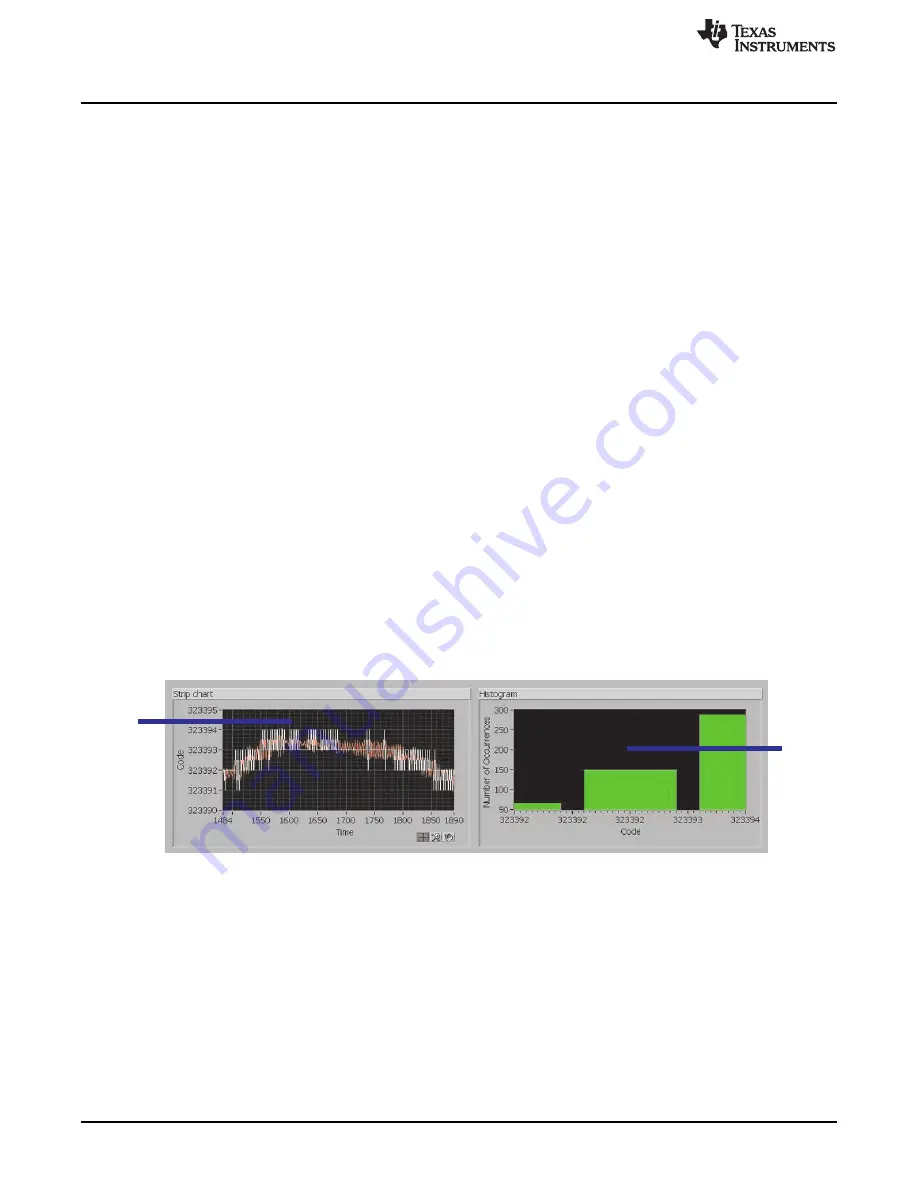
Histogram
Strip Chart
Using the PC Software
4.4
Analysis or Record Mode
The program operates in analysis mode or record mode. Both modes acquire the data and update the
displays, but record mode also writes the result to the selected file.
4.5
Adjusting Device Parameters
To adjust device parameters, use the controls in the Device control box. Each control corresponds to a
setting that can also be made from the board itself.
4.6
Acquiring Data
To start receiving and analyzing data from the board, click the Acquire button, located in the lower
right-hand corner of the display. The program begins to receive data from the board, displaying the results
in near-real time.
It is not possible for the program to adjust board parameters in Analysis mode. For this reason, the board
controls are disabled and dimmed while Analysis occurs.
4.6.1
Averaging
The PC software can process data collected from the board using a sliding-window averager. The controls
for the averager are found in the Averager box.
To turn the averager on, use the Averaging switch. The number of points averaged is set by the Points
control, and the number of points currently collected is shown in the Collected box.
When the averager is turned on, it is cleared. To reset the averager, turn it off and then on again.
The histogram displays an integer representation of the averaged data. Note that when selecting a high
number of averages, the integer results might include only one code; the histogram for that case is blank.
The strip chart display shows both the full precision result of the averages and the integer version, as
illustrated in
.
Figure 7. ADS1232REF Average Data
16
ADS1232REF User
'
s Guide
SBAU120B
–
November 2005
–
Revised July 2011
Copyright
©
2005
–
2011, Texas Instruments Incorporated