Chapter 17: Activities
304
Zooming In on the Graph
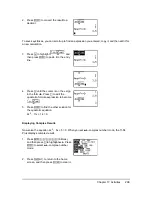
To help identify maximums, minimums, roots, and intersections of functions, you can magnify the
viewing window at a specific location using the
ZOOM
instructions.
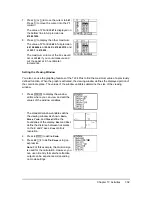
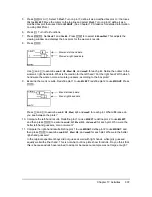
7. Press
Í
.
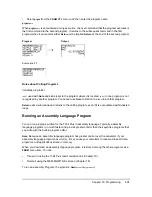
The trace cursor jumps to the point on
the
Y1
function evaluated at
X=3.8
.
8. Press
|
and
~
until you are on the
maximum
Y
value.
This is the maximum of
Y1(X)
for the
X
pixel values. The actual, precise
maximum may lie between pixel values.
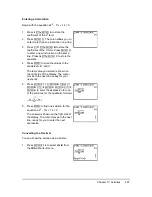
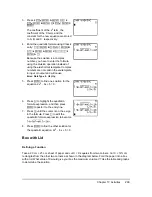
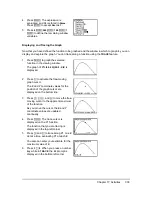
1. Press
q
to display the
ZOOM
menu.
This menu is a typical TI-84 Plus menu.
To select an item, you can either press
the number or letter next to the item, or
you can press
†
until the item number or
letter is highlighted, and then press
Í
.
2. Press
2
to select
2:Zoom In
.
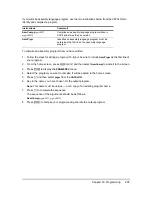
The graph is displayed again. The cursor
has changed to indicate that you are
using a
ZOOM
instruction.
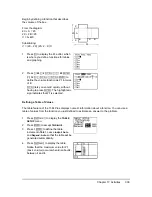
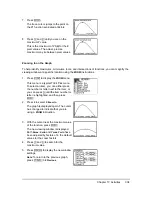
3. With the cursor near the maximum value
of the function, press
Í
.
The new viewing window is displayed.
Both
Xmax
N
Xmin
and
Ymax
N
Ymin
have
been adjusted by factors of 4, the default
values for the zoom factors.
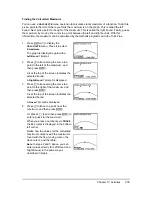
4. Press
|
and
~
to search for the
maximum value.
5. Press
p
to display the new window
settings.
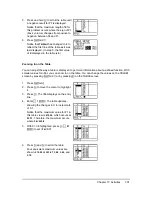
Note
: To return to the previous graph,
press
q
~
1:ZPrevious
.

