Teledyne Kibra DDR Скачать руководство пользователя страница 44

Teledyne


LeCroy

Recording


Options


Setup

42


Kibra


DDR


Protocol


Analyzer


User


Manual

2.6.2

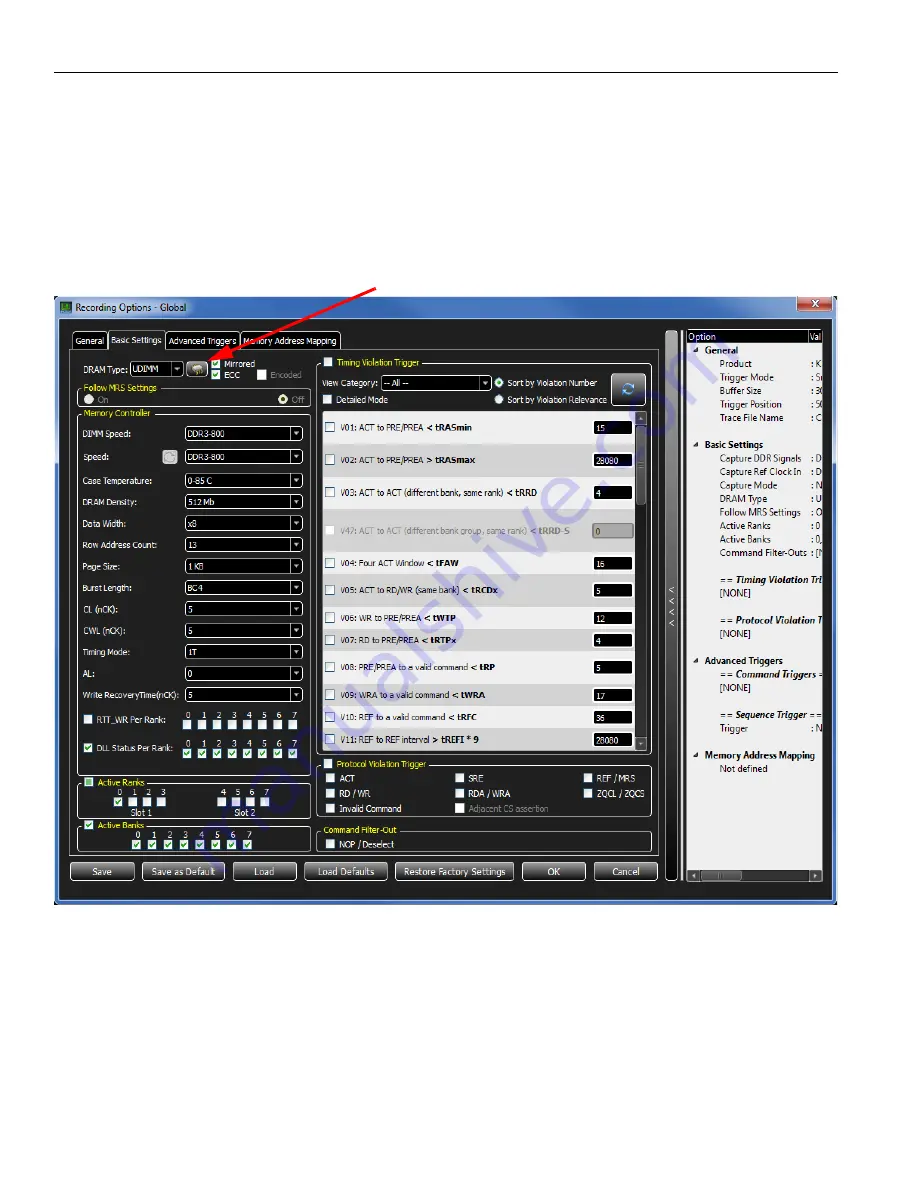
Recording Options - Basic Settings Tab

The


Basic


Settings


tab


displays


the


Memory


Controller


settings,


Capture


settings


and


the


Timing


and


Protocol


Violation


Trigger


values.


There


is


a


direct


correlation


between


the


settings


selected


in


the


Memory


Controller


and


the


Timing


Violation


Trigger.


The


Timing


Violation


Trigger


values


are


based


on


what


memory


settings


are


made.

Figure 2.11:  DDR3 Recording Options Dialog: Basic Settings Tab

Click


on


this


icon


to


display


the


SPD


information

Содержание Kibra DDR

Страница 1: ...Kibra DDR Protocol Analyzer Suite User Manual Software Version 2 40 Document Version 2 40 November 2013 ...

Страница 2: ...DATIONS IN THIS MANUAL ARE BELIEVED TOBE ACCURATE BUT ARE REPRESENTED WITHOUT WARRANTYOF ANY KIND EXPRESS OR IMPLIED USERS ARE FULLY RESPONSIBLE FOR THEIR APPLICATION OF ANY PRODUCTS THE SOFTWARE LICENSE ANDLIMITED WARRANTY FOR THE ACCOMPANYING PRODUCT ARE SET FORTH IN INFORMATION THAT SHIPPED WITH THE PRODUCTAND ARE INCORPORATED HEREIN BY THIS REFERENCE IF YOU ARE UNABLE TO LOCATE THE SOFTWARE LI...

Страница 3: ... 380 or Kibra 480 Front Panel 12 1 2 Specifications 13 1 2 1 Package 13 1 2 2 Power Requirements 13 1 2 3 EnvironmentalConditions 13 1 2 4 Switches 13 1 2 5 LEDs 13 1 2 6 Recording Memory Size 13 1 3 Installing Your Kibra 380 or Kibra 480 Protocol Analyzer 14 Software Installation 14 System Restart 14 Error Message 14 1 4 Hardware Setup 14 1 4 1 Connecting in General 14 Power on Procedure 17 1 5 D...

Страница 4: ...ocol Analysis 31 2 1 Main Window 31 2 2 Software Menus and Toolbar 32 2 3 Application Menu Options 34 2 4 File 34 2 5 Setup 35 2 6 Recording Options Setup 36 2 6 1 Recording Options General Tab 38 Product 38 Recording Type Trigger Mode 38 Snapshot Mode 38 Manual Trigger Mode 38 Event Trigger Mode 39 Buffer Size 39 Trigger Position 39 Note 40 Trace Filename Path 40 Capture 40 2 6 2 Recording Option...

Страница 5: ...Decoding Read Write Commands in Waveform Listing View 69 Search on System Address 70 2 7 Devices 70 2 8 CrossSync Control Panel 71 2 8 1 Launching the CrossSync Control Panel 71 2 9 Preferences 72 2 9 1 General 73 2 9 2 DDR3 Lines Properties 75 2 9 3 DDR4 Lines Properties 76 2 9 4 Symbol Coloring 77 2 9 5 Waveform View 78 2 9 6 Listing View 79 2 9 7 Bank State View 80 2 9 8 RTS View 82 2 10 Reset ...

Страница 6: ...02 Chapter 3 Viewer Display 103 3 1 Window Management 103 3 2 Waveform View 103 3 2 1 Clock Position Selection 103 3 2 2 Viewport Slider in Navigation Bar 104 3 2 3 Snap to Edge 105 3 2 4 Placing Cursors 105 3 2 5 Zoom In and Zoom Out 106 3 2 6 Overlay Signals Mode 106 3 2 7 Zoom Box 107 3 2 8 Context Sensitive Menu 109 3 2 9 Choosing Chip Select Color Highlighting 110 3 2 10 Timing and Protocol V...

Страница 7: ... Column 119 Cursors 119 3 3 Viewport Slider Navigation Bar 127 3 3 1 Traces Captured with Filtering Enabled 127 3 3 2 Gap Markers 129 3 4 Listing View 130 3 5 Bank State View 131 3 5 1 Supported States in the Bank View State 131 Legend Display 132 Active States 133 Configuring Visible Banks 134 Common Features of Bank State View and Waveform View 134 3 5 2 Views 135 Maximum Zoomed In View 135 Defa...

Страница 8: ...READ to PRECHARGE delay 157 5 1 8 V08 tRP PRECHARGE to a Valid Command 157 5 1 9 V09 tWRA WRA to a Valid Command 157 5 1 10 V10 t RFC REFRESH to a Valid Command 158 5 1 11 V11 tREFI REFRESH Interval 158 5 1 12 V12 tRTR READ to READ delay DDR3 same rank DDR4 same bank group 158 5 1 13 V13 tdrRTR READ to READ delay different rank same DIMM 158 5 1 14 V14 tddRTR READ to READ delay different DIMM 158 ...

Страница 9: ... Sequence to a Valid Command 162 5 1 38 V39 tZQOper ZQCL to a Valid Command 162 5 1 39 V40 tZQinit First ZQCL after Reset to a Valid Command 162 5 1 40 V41 tMRD MODE Register Set to Mode Register Set 162 5 1 41 V42 tMOD Mode Register Set Command to a Valid Command 163 5 1 42 V43 tXPR First Clock Enable High after Reset to MRS 163 5 1 43 V44 CCD S Read to Read Delay short Different bank group same ...

Страница 10: ...Teledyne LeCroy Contents 8 Kibra DDR Protocol Analyzer User Manual ...

Страница 11: ...ew The Kibra 380 or Kibra 480 Protocol Analyzer provides a platform for developing and debugging protocol issues in environments which allow DDR3 and DDR4 probing using the interposers connected to the front of the Kibra box Currently the Interposer Probes target DIMM and SODIMM sockets of various types Contact Teledyne LeCroy for the most recent offerings of Interposers DDR Command control signal...

Страница 12: ... the shipper and Teledyne LeCroy Corporation Retain all shipping materials for shipper s inspection 1 1 3 Kibra 380 or Kibra 480 Features Supports the JEDEC specification JEDEC defines the DDR specification Records CMD ADD CNTRL bus Clock based timing displays Fast upload Large sample capture 4GB of Recording Memory 500 Million Samples Triggers for JEDEC timing violations Triggers for JEDEC protoc...

Страница 13: ...otocol The Analyzer observes CMD ADD CNTRL bus and processes JEDEC protocol requirements in real time Errors can be seen in the Waveform view or the Listings view as well as in the Traffic Summary Errors listed in the Traffic Summary have a Hyperlink directly to the Waveform and Listing view to allow quick viewing of errors Clock Based Timing The Analyzer features clock based timing The clock time...

Страница 14: ... features on the front panel Power LED Status LED Trigger LED Slots 1 and 2 for Interposers Interposer Power Connector Read and Write SMA Connectors Figure 1 1 Front Panel On the back the Analyzers have External Trigger Input and Output Reference Clock In Sync In and Out Connectors USB Port for host machine connectivity DC Input 12 volt 5 Amps Power Switch Figure 1 2 Back Panel ...

Страница 15: ...s DC power connection Trigger IN OUT input BNC host machine connection USB type B Data connector Data In Out 9 pin DB Weight 2 6 lbs 1 1 kg Input Power 90 to 254 VAC 47 to 63 Hz universal input 100 W maximum Operating Temperature 0 to 55 C 32 to 131 F Storage Range 20 to 80 C 4 to 176 F Operating Humidity 10 to 90 non condensing Operating Altitude Up to 6560 feet 2000 meters Power on off LEDs Illu...

Страница 16: ...lete the installation System Restart It is recommended that you restart your host machine before you use your Analyzer software Error Message If you get an error message during installation of the drivers for Window consult your system administrator Your system may allow only administrator level users to copy such driver files 1 4 Hardware Setup 1 4 1 Connecting in General Note You must install th...

Страница 17: ...nual 15 Hardware Setup Teledyne LeCroy Figure 1 3 Analyzer Connections 3 Turn off the host machine protocol analyzer and Host Under Test HUT 4 Insert the DDR SDRAM memory into the DIMM socket on the interposer top s 1 2 3 3 4 4 5 5 6 6 7 ...

Страница 18: ...er section select the properties of the DIMM to analyze including the DIMM Speed and CAS Latencies Uncheck the Timing Violation Trigger checkbox to cancel triggers Uncheck the Protocol Violation Trigger checkbox to cancel triggers Click OK to use the defaults for all other settings 11 The HUT can be turned on either now or after recording starts 12 Click Start Recording on the Tool Bar The system ...

Страница 19: ...to the system under test AND power is OFF on the system under test 4 Power On the Kibra unit and wait until the Phy s have completed initialization 5 Power On the system under test 1 5 DDR Interposer The Kibra Interposers sit between the Host Under Test HUT DIMM slots and the DIMMS under test The interposers add less than 1 inch of trace length and a resistive tap to minimize effects on signal qua...

Страница 20: ...ra 380 or Kibra 480 Slot 1 Interposer Protocol Checking is performed on up to 4 ranks in a single slot Mode register capture is supported on up to 8 ranks in 1 or 2 slots The Kibra 380 Slot 1 Interposer is shown below Figure 1 5 Slot 1 Interposer Figure 1 6 Slot 1 Interposer with DIMM ...

Страница 21: ...probing a DIMM on the HUT Leaving it unconnected will cause some signals to float causing false errors to be reported in the trace Figure 1 7 Slot 2 Interposer 1 5 3 External Trigger Out Pulse Width 280 ns Pulse Voltage 3 3 Volts into 1 MegOhms Pulse Voltage 2 7 Volts into 50 Ohms Pulse is positive going Accumulated Latency from DDR Event to Pulse out at SMA terminal DIMM_CLK 400MHz 125 ns DIMM_CL...

Страница 22: ...eed to be actively recording The settings in the recording options tab have no effect on the low latency SMA trigger out feature The Read Write trigger out ports on the front of the analyzer generate a very short pulse width of about 1 25 ns for 800 MHz DDR3 and relatively low amplitude of 560 mVp p after 1 m cable This trigger out signaling differs from the LVTTL Trigger out on the back of the an...

Страница 23: ...the analyzer back Connect Out connectors to In connectors of the next unit in the chain You must provide external hubs for connecting the host machine to these units using USB cables You can daisy chain up to four units Note Because chain connections for daisy chained boards cause delay of signals traffic on different boards is not completely time synchronized with about 100 nanoseconds of differe...

Страница 24: ...ug in one end of the CATC Sync cable to the CATC Sync Out connector of one unit and the other end to the CATC Sync in connector of another To connect another unit continue this chain see Figure 1 8 2 The software will recognize the connections automatically Figure 1 8 Daisy Chaining Units using CATC Sync Cable and CATC Connectors ...

Страница 25: ...t analyzers for synchronization and manage the recording process Captured traffic is displayed using the latest analyzer software in separate windows with all the protocol specific search and reporting features Captured packets are displayed in separate windows that share a common time scale Navigating the traffic in either direction will scroll to the same timestamp in a synchronized window The t...

Страница 26: ...dow or select DDR Protocol Suite from the Start Programs LeCroy menu The following screen displays The Device Bar has the following panes as shown in the following figure 1 Device Shows attached device by Serial Number 2 Quick Recording Options Enables Trigger and Buffer settings 3 Recording Control and Status Start Stop and Pause recording and view status 4 Real Time Statistics View the statistic...

Страница 27: ...ices on Launching the Analyzer The Analyzer Devices window opens displaying the connected devices A blue shading through the entry indicates that a device is being selected and this device will be the one used when you select the Update Device Update License or About buttons The checkbox indicates that this device can participate in recording traces Figure 1 12 Analyzer Devices Dialog It automatic...

Страница 28: ... Figure 1 14 Device Update Dialog 2 Select a device by clicking the applicable box to the left of it and click Update Selected Note You may choose to update all the devices by clicking Update All The following Update Device dialog displays Figure 1 15 Device Update Dialog during Update The following screen displays once the update is complete Click OK to for the update to take effect ...

Страница 29: ...additional analyzers 1 7 2 About The Help About menu option provides current details of the hardware software firmware and bus engine Figure 1 16 About DDR Protocol Suite Note In the event the Kibra 380 or Kibra 480 system contains firmware that is down rev or not supported in the installed version of software the about box will indicate this by showing the firmware revision number in red see figu...

Страница 30: ...he correct revision number in green as shown below Figure 1 17 About DDR Protocol Suite showing updated version 1 8 Using the Software The Kibra 380 or Kibra 480 application has protocol analysis software see Figure 1 18 on page 29 to capture data trigger and view data See Protocol Analysis on page 31 ...

Страница 31: ...ocated in Program Files LeCroy DDR Protocol Suite Data Examples The Kibra 380 or Kibra 480 detects 67 Protocol violations real time over all banks and ranks that total 300 individual checks Protocol Checking is supported on channels of one or two slots Channels of more than two slots require cascaded Kibra Analyzers to monitor the additional slots 1 9 1 Viewing Captured Data After opening the ddrt...

Страница 32: ...Results Hyperlink back to points of occurrence within the Waveform Listing and Bank State views Statistical display Bandwidth Reads Writes all commands total and of total Kibra Supports Traffic Summary Reads Total by Bank Writes Total by Bank Total and by Bank Timing Calculator View is used to measure the differential time between two Triggers or two Markers Last MRS Values shows the last MRS sett...

Страница 33: ...tension Recording Options define what to capture what the analyzer triggers on and the memory settings You can save trace files as ddrt files for later use 2 1 Main Window On the Analyzer Menu Bar click File Open to open an existing Trace File The files use the ddrt extension short for DDR Trace The following software application main screen displays Figure 2 1 DDR Protocol Suite Application ...

Страница 34: ...oss the view Viewport Slider only in WaveForm View The slider enables moving across the view Refer to Viewport Slider Navigation Bar on page 127 Save icon Click to save a file Refer to File on page 34 Recording Options icon Refer to Recording Options General Tab on page 38 Device icon Refer to Devices on page 70 Start icon Click to start a recording Stop icon Click to stop a recording Abort icon C...

Страница 35: ... on page 22 Waveform View icon Click to display the Waveform View see Waveform View on page 78 Listing View icon Click to display the Listing View see Listing View on page 79 Bank State View icon Click to display the Bank State View see Bank State View on page 80 Traffic Summary View icon Click to display the Traffic Summary View see Traffic Summary on page 137 Timing Calculator View icon Click to...

Страница 36: ... Goto Marker icon Select from the drop down list to go to a specific cursor see Markers on page 116 Goto Cursor icon Select from the drop down list to go to a specific cursor see Cursors on page 119 Back to the previous navigated position icon Click to go back to the next navigated position Forward to the previous navigated position icon Click to go forward to the previously navigated position Fin...

Страница 37: ...ing trace or sample files Save Click to save an existing trace or sample files Save as Click to save an existing trace or sample files with a different name or directory Export To CSV Export file in CSV format Export To DDRX Export file in DDRX format Export raw captured data in DDRX file format for offline processing The DDRX file format is available to users who would like to process the signal ...

Страница 38: ... Analyzer SN 63373 is selected Figure 2 5 Recording Options Menu You can also click on the Recording Options icon on the top menu bar The Recording Options Dialog has three tabs The General tab enables you to set the general recording configurations The Basic Settings tab displays the Memory Controller settings Capture settings and the Timing and Protocol Violation Trigger values The third tab Adv...

Страница 39: ...og It gives an overview of the Options selected and their Values To hide this pane click on the vertical bar on the left of this pane The bar acts as a toggle to show and hide the pane See the right pane in Figure 2 6 In the Recording Options dialog tooltips are available in the Basic Settings and Advance Triggers Tabs Tooltips are also displayed on the right panel displaying the Options and Value...

Страница 40: ...yzer triggers on the first data pattern on the bus Starting a data capture with Event selected triggers when specific event s are detected in the captured data stream The following three ways can trigger the analyzer with Event selected Trigger on Specific DDR3 or DDR4 Commands Trigger on DDR3 or DDR4 Protocol or Timing Violations External Trigger in from other test equipment Figure 2 7 Trigger Se...

Страница 41: ...o change memory usage for recording trace data Minimum size of memory is 1MB Maximum size of Memory is 4GB 512Mega Samples It is recommended that you limit the size of the capture buffer to half of the memory of your host machine to achieve the best performance Trigger Position This defines the portions of the buffer which are used before and after the trigger It does not apply to snapshot recordi...

Страница 42: ... files can only be saved as ddrt files You must select a location that is considered writeable to the operating systems Figure 2 9 Trace File Name Capture There are three possible options for capturing a trace DDR Signals Only DDR Signals with Ref Clk In and Ref Clk In Only DDR Signals This should be the default capture mode for DDR analysis Select from either DDR3 or DDR4 Ref Clock In This will e...

Страница 43: ...is done if a user wants to export to a DDRX file for their own processing The following options are available Save As Opens the Save Display Configuration File dialog to save the changes made to the Preferences for future use They can be saved in the default location or you assign a name and save in a library Save as Default Click this button to restore the settings to the factory presets Load All...

Страница 44: ...ttings Capture settings and the Timing and Protocol Violation Trigger values There is a direct correlation between the settings selected in the Memory Controller and the Timing Violation Trigger The Timing Violation Trigger values are based on what memory settings are made Figure 2 11 DDR3 Recording Options Dialog Basic Settings Tab Click on this icon to display the SPD information ...

Страница 45: ...ings Tab Click on the SPD Serial Presence Detect icon to view the SPD information as shown above to display the SPD information window see Figure 2 13 on page 44 This feature is available on interposers which support SPD capture Only the Kibra 380 DDR3 UDIMM does NOT support SPD reading Click on this icon to display the SPD information ...

Страница 46: ...Teledyne LeCroy Recording Options Setup 44 Kibra DDR Protocol Analyzer User Manual Figure 2 13 SPD Information ...

Страница 47: ...ich addressing scheme your system and DIMMs support Click the checkbox to select it Use CS2 as A16 in both slots Use CS3 as A17 in both slots Mirrored Select the Mirrored check box to Trigger and Display data correctly for a UDIMM which has a Mirrored configuration ECC Check the ECC box if your system uses Error Correction Coding Encoded Selecting this checkbox see Figure 2 14 on page 46 for DDR4 ...

Страница 48: ...dynamically adjust certain JEDEC parameters used for error triggering and error analysis Once captured the MRS View will display what the most recent MRS parameters were at any particular time point in the captured trace When Follow MRS Settings is turned on items which are effected dynamically by MRS commands are highlighted in green see Figure 2 15 on page 47 If Follow MRS Settings is turned off...

Страница 49: ... Parameters in the Timing Violation Trigger Pane Be careful to select values which match the current host machine and DIMM under test The following values are displayed in the Memory Controller pane see Figure 2 16 on page 50 DIMM Speed This selects the nominal DIMM speed as provided by the manufacturer This is different than the Speed setting which selects the actual speed that the memory control...

Страница 50: ...512MB to 8GB Data Width Select from three data width options from the dropdown menu x4 x8 x16 Row Address Count Select from the drop down options from 12 to 16 Page Size The Page Size is determined by the OS Select from 1KB or 2KB Burst Length Two Burst Lengths can be selected from the drop down menu BC4 Burst Chop 4 or BL8 Burst Length 8 Burst Length OTF On The Fly is not currently supported For ...

Страница 51: ...Address Latency can be disabled or set to the required number of clocks through the pull down menu RTT_WR Per Rank Check the boxes for each rank that uses Dynamic ODT On Die Termination DLL Status per Rank DDR3 Enable or Disable DLL Status per Rank by clicking the checkbox This selects which of tXP or tXPDLL to use to check for Fast Slow exit from Power Down respectively Select from 0 to 7 If Foll...

Страница 52: ...anks You can specify from 0 to 7 It is important to note that disabling banks can have adverse effects on triggering of certain commands see Figure 2 16 DDR4 There are four Bank Groups see Figure 2 16 on page 50 Note Hold mouse over fields to display tooltips Figure 2 16 Memory Controller Settings DDR3 DDR4 ...

Страница 53: ...ll not enable the refresh button for the timing violation triggers The software will populate the Timing table with the last valid set of timing values The user may modify the individual timing values manually as desired Note If operating the analyzer with invalid memory controller parameters the analyzer software will capture normally but may flag numerous timing violations Figure 2 17 Error in M...

Страница 54: ...ied after this action if desired Below is the list of timing violations the user should set manually in Recording Options as these cannot be automatically calculated based on DIMM selection parameters V13 READ to READ different rank same DIMM tDRRTR V14 READ to READ different DIMM tDDRTR V16 READ to WRITE different rank same DIMM tDRRTW V17 READ to WRITE different DIMM tDDRTW V19 WRITE to READ dif...

Страница 55: ...ers are selected they will be OR conditioned with any other trigger events that are also active Users may customize the individual trigger events by enabling or disabling the check box next to the Violation number Note The timing and protocol violations specified in this window will also be used to identify possible errors in the trace during post process analysis The post process error analysis o...

Страница 56: ...yne LeCroy Recording Options Setup 54 Kibra DDR Protocol Analyzer User Manual Timing Violation Trigger Values for DRAM Operations DDR4 Figure 2 21 Timing Violation Trigger Values for Read Write Commands DDR3 ...

Страница 57: ...DDR Protocol Analyzer User Manual 55 Recording Options Setup Teledyne LeCroy Timing Violation Trigger Values for Read Write Commands DDR4 Figure 2 22 Timing Violation Trigger Values for Low Power States DDR3 ...

Страница 58: ...56 Kibra DDR Protocol Analyzer User Manual Figure 2 23 Timing Violation Trigger Values for Low Power States DDR4 Timing Violation Trigger Values for Initialization Commands DDR3 Timing Violation Trigger Values for Initialization Commands DDR4 ...

Страница 59: ...s timing violation s tRTR tWTW tRTW values are calculated according to new formulas and are not same as the normal read write timing violations in active states The DDR Suite handles all required calculations in the MPR state when Follow MRS Settings mode is On and shows trigger violations according to the requirements in the MPR state When Follow MRS Settings mode is Off the software will disable...

Страница 60: ... was not Activated Invalid Command Invalid commands A command is detected before a valid Clock signal was received SRE Self Refresh Enter command in all states except Idle Self Refresh Enter occurred before all banks were Idle RDA WRA Read Auto or Write Auto commands in all states except Active The Read Auto or Write Auto Command is detected for a Bank that was not Activated Adjacent CS assertion ...

Страница 61: ... Low The active low or active high nature is already taken into account in the signal naming For example CS0 being selected means the electrical value goes low but CS0 is thus shown as high Triggering can be performed on a specific command on a Read Write or both The Read and Write commands can be triggered on a specific physical address or users can define a sequence of commands or signal states ...

Страница 62: ...Teledyne LeCroy Recording Options Setup 60 Kibra DDR Protocol Analyzer User Manual Figure 2 27 Recording Options Dialog Advanced Triggers Tab ...

Страница 63: ...Figure 2 28 Command Trigger Settings UDIMM and SOUDIMM Selected for DDR4 Note Hold mouse over fields to display tooltips RCW BCW Commands Trigger The Kibra unit provides for triggering on RCW Register Control Word BCW Buffer Control Word commands Because these commands are available only on RDIMM LRDIMM modules you should select the correct memory type from RDIMM LRDIMM or SORDIMM to activate Once...

Страница 64: ...LRDIMM and SORDIMM Memory Selected for DDR3 Figure 2 30 RCW BCW Command Trigger Settings RDIMM and LRDIMM Memory Selected for DDR4 Read Write Trigger Read and Write triggers can be set to be performed on the specified row column ranks and banks Figure 2 31 Read Write Trigger Settings Note Hold mouse over fields to display tooltips ...

Страница 65: ...2 34 on page 65 After specified nck Figure 2 32 Sequence Trigger Settings Note Hold mouse over fields to display tooltips The Sequence Trigger feature provides a powerful triggering engine which allows for defining the trigger at the signal level with arm and roll back condition You can define the following trigger conditions Trigger on any signal transition Trigger on combination of signals that ...

Страница 66: ...e to Low Low Low and the CS1 to Low all other CS s at Don t Care Alternatively if you want to trigger on any case where the RAS CAS and WE are Low you would leave all the CS s at Don t Care For chip select signal an Any Chip Select option is provided This allows you define an or condition on all ranks This means that if other signal conditions occur on any other chip select the engine considers it...

Страница 67: ...1 and ODT2 Low would be X0XX etc Clock Present Clock Present triggers when either the clock is seen or the clock is disabled for a short period of time see Figure 2 35 on page 66 This can be used to trigger on the clock going away for a period of time This is done by using a sequence trigger as follows Arm on Clock Present Clock Disable This will arm whenever the clock stops for a short time Trigg...

Страница 68: ...ng options in the Memory Address Mapping tab see Figure 2 36 on page 67 You can choose from Use External plugin This is not supported in release 2 30 It will be implemented in a future release Define system address mapping The Memory Mapping tab allows the user to define how their system memory maps to the physical memory of the DIMM This dialogue allows you to customize the system address by drag...

Страница 69: ...d Column addresses to System Address provides the capability of working with System Address in other parts of software The three main areas that benefit from the use of System Address are Read Write on Specific Address Trigger If the System Address is defined in the Recording Options the user can specify the target address by entering the desired value in System Address Ranks Banks Row and Column ...

Страница 70: ...ddress patterns and it is enabled when the user defines a System Address pattern Note The trigger occurs according to the field values in Rows Columns Ranks and Banks Hence if user modifies the value of these fields after specifying the target address the changed mapped values take effect Figure 2 37 Read Write on Specific Address Trigger Use System Address ...

Страница 71: ...dyne LeCroy Decoding Read Write Commands in Waveform Listing View The software will show complete System Address of any read write command in the waveform command description tooltip and listing view column Figure 2 38 Decoding Read Write Commands in Waveform Listing View ...

Страница 72: ...s Trigger section the software will fill other field s value according to the specified System Address in the Search dialog Figure 2 39 Search on System Address 2 7 Devices Click on Setup and select Devices You can also click on the Analyzer Devices icon on the top menu bar Figure 2 40 Setting up Devices on Launching the Analyzer The Analyzer Devices window opens displaying the connected devices s...

Страница 73: ...Panel allows you to select multiple types of Teledyne LeCroy Protocol Analyzers for synchronization and manage the recording process 2 8 1 Launching the CrossSync Control Panel To launch CrossSync from the Kibra 380 Protocol Analyzer or Kibra 480 DDR4 Protocol Analyzer software application select the Launch CrossSync Control Panel in the Setup menu see the screen below Or you can launch CrossSync ...

Страница 74: ... your customized configuration Click on Setup Preferences to configure your settings Figure 2 43 Preferences Menu Option The Preferences dialog is displayed Figure 2 44 Preferences Dialog The following tabs in the Display View Configuration dialog are described below General DDR3 Lines Properties DDR4 Lines Properties Symbol Coloring Waveform view ...

Страница 75: ...o cancel any settings just made Apply Applies the changes made to the open trace file Note Preferences from version 1 20 and above should be usable upgradable in future versions but those made with releases below 1 20 should be deleted as they are not forward compatible 2 9 1 General The General tab see Figure 2 45 on page 74 allows you set the Time Stamp Reference The four options are Synchronize...

Страница 76: ...Teledyne LeCroy Preferences 74 Kibra DDR Protocol Analyzer User Manual Figure 2 45 General Dialog ...

Страница 77: ...lect the DDR3 Command from the left pane and select the font from the drop down font list to change the font and select change a font size Click on the Radix drop down list to select the format such as text Hex Dec Oct Bin etc Click on the Line Color button to select a color for the line Basic and Custom color options are available Once the properties are selected and applied they will apply to th...

Страница 78: ...lect the DDR4Command from the left pane and select the font from the drop down font list to change the font and select change a font size Click on the Radix drop down list to select the format such as text Hex Dec Oct Bin etc Click on the Line Color button to select a color for the line Basic and Custom color options are available Once the properties are selected and applied they will apply to the...

Страница 79: ...foreground and background color for DDR Commands Protocol Violations and Timing Violations Each line stays the same color across the view Different colors can be assigned to Protocol and Timing Violations to distinguish between them This is designed to make them more visible in the Waveform and Listing Views Figure 2 48 Symbol Coloring Dialog ...

Страница 80: ...inction of information in the view The colors can be set for each of the following elements of the view Main The background and foreground colors can be selected Ruler The background and foreground colors can be selected Selected Row Only the background color can be selected Layout Check boxes to Show Grid Lines and Anti Alias drawing Time Stamp Cursor The background and foreground colors can be s...

Страница 81: ...lack and white 2 COLOR_SKIN_1 This color scheme is consistent with the application 3 COLOR_SKIN_2 This color scheme is bright Within the color schemes you can select and change standard settings such as the background and foreground colors for the Main window Time Column set the font and font size Marker Column set the font and font size Selected column Index column set the font and font size and ...

Страница 82: ... Only the background color can be selected States Active Power Down Precharge Power Down Self Refresh Active Idle Unknown and PDA Enable colors can be selected Note PDA Per DRAM Accessibility This state makes a difference in decoding since it has an impact on MRS timings tMRD tMOD These impacts are applied on MRS timings automatically when the modules are in this state and the Follow MRS setting m...

Страница 83: ...Kibra DDR Protocol Analyzer User Manual 81 Preferences Teledyne LeCroy Figure 2 51 Bank State View Dialog ...

Страница 84: ...ge 81 Choosing various colors allows for easier distinction of information in the view The colors can be set for each of the following elements of the view General Select Interval by clicking the up down arrows Check or un check Auto scroll Check or un check Sync Graphs Color Select The Read color can be selected The Write color can be selected The Power Down color can be selected The Self Refresh...

Страница 85: ...equence This should not be necessary during normal operation of the Analyzer Figure 2 54 Reset Interposers Menu Option 2 12 Session The Session menu options allows you to start stop or abort a capture see Figure 2 55 on page 84 You can also manually trigger by selecting Manual Trigger The Session menu has the following capture options Start Recording starts a trace capture Stop Recording stops a t...

Страница 86: ...Calculator View opens the Timing Calculator View see Timing Calcula tor View on page 142 Last MRS Values opens the MR Values View see Last MRS Values on page 143 Row Usage Report opens the Row Usage report see Row Usage Report on page 144 Timing Violation Analysis View opens the Timing Violation Analysis View see Timing Violation Reanalysis on page 147 Trace Information Shows the information about...

Страница 87: ...rm View The Waveform View for each captured signal can be viewed The user can collapse expand multiple signals into Busses i e CMD ADDR and zoom and scroll through the waveform data Figure 2 57 Waveform View For additional information on the Waveform View See Waveform View on page 103 ...

Страница 88: ... User Manual 2 15 Listing View The Listing View for each captured signal can be viewed The Listing View displays the text based decode of commands in time order Figure 2 58 Listing View For additional information on the Listing View see Listing View on page 130 ...

Страница 89: ...t is separated by bank to enable a more insightful picture of the activity in a way that is often obfuscated in a waveform view The user can collapse expand multiple signals into individual banks in a rank and zoom and scroll through the traffic on a specific bank Figure 2 59 Bank State View For additional information on the Bank State View See Bank State View on page 131 ...

Страница 90: ... of the commands performance and violations For additional information see Traffic Summary on page 137 Figure 2 60 Traffic Summary View 2 18 Timing Calculator View The Timing Calculator View can be used to determine the time in clocks or actual time between any two locations in the trace Figure 2 61 Timing Calculator View For additional information on the Timing Calculator View See Timing Calculat...

Страница 91: ...tailed formula describing how the calculation of those violations were determined Affected timing violations are highlighted in green Checking the Horizontal check box aligns the display horizontally and checking the Vertical check box aligns it vertically Figure 2 62 Last MRS Values Dialog 2 20 Row Usage Report The Row Usage Report see Figure 2 63 on page 90 is a powerful analysis tool in DDR Pro...

Страница 92: ... to run the Violation Check on the trace data with revised values for the timing parameters You can do What if scenarios to see if the new values would have created violations had they been in place during the capture The default for Follow MRS Settings is OFF in this feature Please ensure it is turned on if you want the software to follow the MRS changes as it analyzes the trace But in that case ...

Страница 93: ...Kibra DDR Protocol Analyzer User Manual 91 Timing Violation Analysis Teledyne LeCroy Figure 2 64 DDR 3 Timing Violation Analysis ...

Страница 94: ...Teledyne LeCroy Timing Violation Analysis 92 Kibra DDR Protocol Analyzer User Manual Figure 2 65 DDR 4 Timing Violation Analysis ...

Страница 95: ...four links on the top of the screen to make them visible Click the Top button to go back to the summary The Precision Trigger Timestamp latches the time at which the trigger signal occurs The trigger Sample Timestamp is the timestamp of the first event shown on the screen after the trigger signal occurs It is possible for these to be very different numbers For example if the trigger occurred from ...

Страница 96: ...currently has the following options Refer to Figure 2 67 Go to Time Displays the GoTo Time dialog to go to a specific time stamp or Clock Count Go to Trigger Allows you to go to the trigger point in the trace Go to Selection Takes you to the selected point Go to Marker Allows you to go to specific Marker see Markers on page 116 Go to Cursor Takes you to where the cursor is located This option is a...

Страница 97: ... Hide NOP DES Commands Allows you to toggle between showing hiding NOP DES Commands Synchronize All Views Allows you to synchronize the positions of the currently selected clock value in all views Manage Synced Traces Allows you to synchronize the times between multiple traces which were captured at the same time using CATC Sync cable as shown in Figure 1 8 on page 22 Zoom in Allows you to zoom in...

Страница 98: ...r issues with a pre addressed e mail via that client This email feature only works if the default mail client is properly configured User Manual F1 Displays the User Manual Requires an installed PDF viewer Video Tutorials Select a web based Tutorial to learn more about the use of your Kibra An Internet connection is required for this Display License Information Displays the License information wit...

Страница 99: ...nalyzer Devices Dialog Register Product Online Displays the Teledyne LeCroy Protocol Analyzers web page to register your product Check for Updates Checks to see if there are any updates available for download Shortcut List Displays a list of general shortcuts and shortcuts in the Waveform and Listing View that can be performed with the mouse and keyboard see Figure 2 73 on page 99 About Displays t...

Страница 100: ...Teledyne LeCroy Help 98 Kibra DDR Protocol Analyzer User Manual Figure 2 72 License Information Dialog ...

Страница 101: ...Kibra DDR Protocol Analyzer User Manual 99 Help Teledyne LeCroy Figure 2 73 Shortcut List ...

Страница 102: ... 8 example files are located in C Users Public Documents LeCroy DDR Protocol Suite Data Examples In Windows XP example files are located in Program Files LeCroy DDR Protocol Suite Data Examples It is strongly recommended that you open some example files to familiarize yourself with the application Run a Sample Analysis To run an example analysis 1 Select File Open 2 Locate an example analysis by l...

Страница 103: ...alyzer User Manual 101 Example Files Teledyne LeCroy Figure 2 75 Open Trace Dialog 4 You can now view the example trace file search for items look at the Traffic Summary Waveform view Listing view and Timing Calculator view ...

Страница 104: ... Example Files 102 Kibra DDR Protocol Analyzer User Manual Figure 2 76 Analyzer Trace Capture Display Saving a Trace You can save a Trace for review at a later time using the Save As dialog Figure 2 77 Save As Dialog ...

Страница 105: ...minimize and maximize the screen The horizontal toolbar can be dragged and placed vertically or horizontally on either side of the screen 3 2 Waveform View The Waveform View for each captured signal can be viewed In the Waveform View the clock is the main source for the data being captured Timing Markers show how long the clocks are apart Refer to Figure 3 1 on page 104 The user can collapse expan...

Страница 106: ...s a full trace in the window as you slide the bar across the bar You can zoom in and out by selecting one end of the bar and dragging it in either direction Figure 3 2 Viewport Slider For more information on the Viewport Slider and Navigation Bar refer to Viewport Slider Navigation Bar on page 127 Navigation Bar Open or close Group tabs by clicking on the box Markers Clock Position Selector Captur...

Страница 107: ... with the mouse to see it Snap to Edge is sensitive in horizontal and vertical positions 3 2 4 Placing Cursors To place a pair of cursors activate the Cursor button as shown below and click the left mouse button to place the left x cursor and then click the right mouse button to place the right y cursor any where in the Waveform view See the pink X1 Y1 and X2 Y2 cursors below Figure 3 4 Placing Le...

Страница 108: ...lay Signals Mode button to toggle between enabling and disabling the overlay signals mode Overlay Signals mode allows you to take a single signal and superimpose it on top of another signal the top signal stays translucent Figure 3 6 Enabling Disabling Overlay Signals Mode To overlay a signal perform the following steps 1 Click on the Enable Disable Overlay Signals Mode button to activate it as sh...

Страница 109: ...n Overlaid Signal 3 2 7 Zoom Box The Zoom Box mode allows you to drag your mouse around an area of the waveform and zoom in on that particular area of the waveform Click on the Zoom Box button as shown see Figure 3 9 on page 108 to toggle between enabling and disabling the zoom box mode The Command Value signal is being overlaid on the Timing Violation signal The Command Value overlays the Timing ...

Страница 110: ...e Zoom Box 1 Click on the Enable Disable Zoom Box Mode button to activate it as shown in the screen capture above 2 When you move the cursor in the Waveform View display it will change to a Plus sign Figure 3 10 Overlaying One Signal over the Other Zoom Box Mode button When activated the button turns blue Cursor changed to a Plus sign to zoom into an area ...

Страница 111: ...xt Sensitive Menu Right click in the Waveform View to display the context sensitive GO to commands see Figure 3 11 on page 109 The commands displayed are based on where you click in both horizontal and vertical locations on the trace Right clicking on a command allows you to go to the next command or to go to the next command of the same type Area selected to zoom in Selected area zoomed in ...

Страница 112: ... 3 12 Go To Commands 3 2 9 Choosing Chip Select Color Highlighting Right click Chip Select to select the color to highlight it in the trace as shown below to display the Select New Color Dialog see Figure 3 14 Figure 3 13 Right click Chip Select Select a color and click OK Zoom Box ...

Страница 113: ...e violation occurred These violations are based on the JEDEC timing values specified by the user in the Recording Options Basic Settings dialog The violation markers are calculated automatically and placed at the clock cycle closest to the point where the violation is detected Tool tips are provided for some violations to provide further explanation of the protocol or timing violation Right click ...

Страница 114: ...either side of the cursor violation by clicking the buttons on the top right corner see figure below The buttons from left to right are Zoom to fit This will change Waveform view zoom and position to show this cursor boundaries X and Y positions in the current view so user can see all parts of this cursor together Go to X Positions the X cursor in the middle of the view without chang ing zoom Go t...

Страница 115: ...bottom To keep the tool tip persistent place your cursor in the tool tip box Click the Hide Detail button to hide the Truth table Figure 3 17 Truth Table Functionality 3 2 11 Right Click Functionality in Waveform View You can perform the following functions when you right click on a Marker in the Waveform View see the following screen capture Figure 3 18 Menu Options on Right Clicking in the Wavef...

Страница 116: ...ected point Set New Marker Markers can be inserted for illustrating JEDEC violations Markers are useful to identify specific points in the data By default markers follow a numbering convention but can be renamed Set and Edit New Marker Displays the Preferences Marker dialog see Figure 3 21 on page 117 Place Marker Moves the selected marker to a new specified position Edit This Marker Enables you t...

Страница 117: ...It is often desired to show or hide specific signals in a signal group such as Address or Chip Select This feature allows you to select the ones to be shown or hidden when the signal group is shown in its expanded form Right click on Chip Select and select Show Hide Sub Signals Chip Select to display the Show Hide Signals dialog see Figure 3 21 on page 117 You can also hide a signal by right click...

Страница 118: ...ted in Waveform Listing and Bank State Views You can also go to specific markers in these three views Right click in the view and select Edit Marker The Edit Markers dialog has the following fields see Figure 3 21 on page 117 Markers Click on this field to view the markers in the drop down list Name Enter or edit the marker name in this field Color Select a color for the marker by clicking on the ...

Страница 119: ...Kibra DDR Protocol Analyzer User Manual 117 Waveform View Teledyne LeCroy Figure 3 21 Edit Markers Dialog ...

Страница 120: ...ywhere in the Waveform Listing or Bank State view to add a marker See Figure 3 22 A marker will display in the data with a default name of Marker 1 Figure 3 22 Right Click to Display Marker Menu Options Note The menu options listed in the previous table can also be selected from the Navigation menu option Navigation on page 94 If the marker is not displayed on the screen hover over the Marker bar ...

Страница 121: ... section below for details Right clicking on the Label for the DIMM channel allows the user to add or remove signals or signal groups from the waveform view Left clicking on the symbol in each label allows the user to expand or collapse a signal group Scrolling the mouse wheel will cause the waveform area to ZOOM In or Zoom OUT Double click at a specific location to move it to the center of the sc...

Страница 122: ...ging up or down Find Click the Find icon to display the Find dialog shown in Figure 3 26 on page 121 It enables finding by the following criteria Search Type Simple Search see See Simple Search on page 121 Sequenced Search Origin Anchor Point Last Found Start of the Trace Direction Forward Backward Search for DDR Commands Command Type Chip Select Bank Group Bank Address MRS Number Read Write Addre...

Страница 123: ...arch for a signal signal group or combination of signals with desired values Combined search will match when the all the conditions match at the same time The default search criteria for signals are don t care X and the user needs to change the search criteria for any signal with the desired value Note Search works on the pure value of signals without any DDR protocol specific post processing like...

Страница 124: ...Teledyne LeCroy Waveform View 122 Kibra DDR Protocol Analyzer User Manual Figure 3 27 Find Dialog Read Write Address ...

Страница 125: ...Kibra DDR Protocol Analyzer User Manual 123 Waveform View Teledyne LeCroy Figure 3 28 Find Dialog Generic Signal Values ...

Страница 126: ...Teledyne LeCroy Waveform View 124 Kibra DDR Protocol Analyzer User Manual Figure 3 29 Find Dialog Protocol Violations ...

Страница 127: ...Kibra DDR Protocol Analyzer User Manual 125 Waveform View Teledyne LeCroy Figure 3 30 Find Dialog Timing Violations ...

Страница 128: ...tions for criteria matches Go to state N Finish Search Criteria button Click here to display available options Tooltip For criteria definition the user needs to click the criteria button and then click the criteria field to display the DDR Suite dialog to select the criteria from the available options The Criteria define dialog DDRSuite is similar to the Simple search dialog and the user can defin...

Страница 129: ...drag it in either direction to quickly move to a specific location see Figure 3 32 You can also move the slider by clicking on the left or right arrow on either side of the Navigation Bar Drag either end of the bar to zoom in and out The red lines in the Navigation Bar show where the Timing and Protocol errors occurred 3 3 1 Traces Captured with Filtering Enabled In traces captured with filtering ...

Страница 130: ...Teledyne LeCroy Viewport Slider Navigation Bar 128 Kibra DDR Protocol Analyzer User Manual Figure 3 33 Trace Capture with Filtering Enabled ...

Страница 131: ... 3 3 2 Gap Markers The areas highlighted below indicate that there was a time lapse here while capturing the trace The Time Lapses are due to either Filtering or to actual clock stoppage The filtered items are also reflected in the Navigation bar Figure 3 34 Time Lapse While Capturing Trace ...

Страница 132: ... data width defined in the Recording Options Markers are inserted for adding user defined comments within the Listing View The listing view shows a listing of each clock cycle on the bus called a sample Left clicking anywhere on a row enables selection of that command The primary marker is indicated by a line just below the selected row Also by selecting this sample the primary selection marker is...

Страница 133: ...bank Click on the Bank State View icon to display the Bank State View The navigation in the Bank State view is similar to the navigation in the Waveform view Figure 3 36 Bank State View 3 5 1 Supported States in the Bank View State In the Bank State View you can view performance on read write activity The view displays low power pre charge idle and active states Expand the Rank to view all the Ban...

Страница 134: ...icient context of prior states makes the current state undetermined The application needs to find a valid command before showing the valid state for that bank Legend Display The DDR Protocol Suite provides a legend that shows the supported states You can display the legend for the Bank State view by right clicking in the view and selecting Show Legend Figure 3 37 shows how to activate the legend a...

Страница 135: ...s Density of Read Write by drawing a graph with specific color for each type in dif ferent time divisions see note below The power down active state when the power down happens in active bank Figure 3 39 Active State Detail Figure 3 40 Visually Comparing RD WR Density in Two Banks Note While calculations involving the numbers of Reads and Writes are used to display the relative density of these co...

Страница 136: ... view configuration is saved in the trace file automatically and the user will see the view with the last configuration when the next file opens Figure 3 41 Configuring Visible Banks Common Features of Bank State View and Waveform View The Bank State View provides all the common features of the Waveform View which are described before in Waveform View on page 103 The important common features are ...

Страница 137: ...ank State View depending on your Zoom level Shown below are Zoom Levels to demonstrate these Maximum Zoomed In View This is the maximum zoomed in view In this view the user can view all the traffic details on a specific bank The main information in this view is active states along the time axis Figure 3 43 Bank State Maximum Zoomed In View Zoom Buttons Cursor Insertion Markers Navigation Bar Ancho...

Страница 138: ...down idle and self refresh states Active and pre charge commands are also shown In the Active state the utilization for read and write is shown along time Figure 3 44 Bank State Default Zoom Level View Maximum Zoomed Out View This is the maximum zoomed out view It provides a higher perspective of traffic but looses details Figure 3 45 Maximum Zoomed Out View ...

Страница 139: ...type of command and the total count It gives the summary of the commands performance and violations Three summaries can be viewed in Traffic Summary All the summaries are described below 1 Commands 2 Performance 3 Violations Traffic Summary Toolbar Tools The Traffic Summary Report has five buttons on the toolbar Figure 3 47 Traffic Summary Menu Option Save as HTML Save as a web page formatted repo...

Страница 140: ...ry Commands A summary of the Commands can be viewed on this page see Figure 3 48 You can view Command in Ranks Command in Banks MRS Commands or Register Control Commands Figure 3 48 Traffic Summary Commands Figure 3 49 Traffic Summary Commands in Ranks Select Ranges Select the range of time for the reports to cover Print Print on a Printer ...

Страница 141: ...Kibra DDR Protocol Analyzer User Manual 139 Traffic Summary Teledyne LeCroy Figure 3 50 Traffic Summary Commands in Banks Figure 3 51 Traffic Summary MRS Commands Figure 3 52 Register Control Commands ...

Страница 142: ...width efficiency for data transfers and the efficiency of power down state transitions when no data transfers occur The report is calculated based on rank and is determined by counting the clocks that occurred while the rank was in a specific state according to these formulas Read Number of read commands burst clock count BL 2 100 Total clock count Write Number of write commands burst clock count ...

Страница 143: ...raffic Summary Violations A summary of the Protocol Timing Violations and Refresh Cycles in Ranks can be viewed on this page see the figures below Figure 3 55 Traffic Summary Violations Figure 3 56 Traffic Summary Protocol Violations Figure 3 57 Traffic Summary Timing Violations ...

Страница 144: ...d Command 3 7 Timing Calculator View The Timing Calculator View is used to measure the differential time between two Triggers or two Markers see Figure 3 60 on page 143 To measure perform the following 1 In the From field enter the first Trigger or Marker 2 In the To field enter the second Trigger or Marker The delta time and clock is displayed in the Delta Time Clock field ...

Страница 145: ...erence settings see Figure 2 62 on page 89 the view values will be updated either by scrolling in the view By Anchor Point option or by clicking on the trace and selecting waveform listing view By Selection point option This view also provides the view of the changing timing violations according to the last MRS values along with detailed descriptions of how the value changed via the tooltip Violat...

Страница 146: ...ated row The user defines the rows desired selects the Write Command and resets on PRE PREA This generates a report showing the min max and average number of writes per activate for the desired row or rows The user should count the number of cycles or time the row was activated for a Write command Another use of the report would be for determining Row Hammering The user defines the desired rows th...

Страница 147: ...ires more analysis time and the result may include some additional items of negligible value which cause report complexity However the user can filter the target items even after analysis by using filter options available in report toolbar see Figure 3 62 on page 144 Rank Bank Group DDR4 Only Bank input fields are binary selection fields which the user can use to specify one or a combination of th...

Страница 148: ...ommands Count Report Dialog Figure 3 65 Cycle Reports Dialog Show Detail Report By pressing this button the user can see the detail of the cycle intervals for the item selected in the Cycle Report grid The description of input fields for the cycle reports is as follows Counted command This field specifies which command type is the target for counting in cycle Periodic counter reset As mentioned be...

Страница 149: ...cles that the counted count has exceeded the max allowed count Figure 3 66 Row Usage Report The Add Cursor button applies to the selected item A Cursor pair will be added into the Waveform view to show where this selected item starts and stops 3 10 Timing Violation Reanalysis The Timing Violation Reanalysis dialog see Figure 3 67 on page 148 allows users to change the timing violation parameters a...

Страница 150: ...alysis 148 Kibra DDR Protocol Analyzer User Manual the Reanalyze entire trace according to selected CAL option to do a full reanalysis of the trace based on the new CAL setting see Figure 3 67 Figure 3 67 Timing Violation Reanalysis Dialog ...

Страница 151: ...is attached The Devices Dashboard consists of three primary areas The recording configuration is on the left allowing the quick selection of Trigger Mode Buffer Size and Trigger Position The middle portion displays the status of capturing and uploading along with the recording controls for that device The right side shows a simplified Real Time Statistics RTS summary which shows the activity on ea...

Страница 152: ...nterval approx 1 4 second The items monitored in RTS are Read Write Power Down Self Refresh MRS Commands RC Commands ZQs ZQl Refresh The display shows the events occurring in real time For the monitored items the current value for a sample interval is shown along with the maximum value seen during this RTS session In addition the throughput is shown as a percentage of the overall bus bandwidth Thi...

Страница 153: ...TS View shows the accumulated counts of violations since the RTS started The accumulated Counts of the events by rank are displayed in the Command Statistics summary at the bottom of the RTS Window Click the Show Ranks button or the Close Box button in the Rank s window to adjust the Rank numbers you are viewing Note On Zooming in the RTS View If you Zoom Out far on the RTS view the actual values ...

Страница 154: ...as CSV format from performance logs It cannot be loaded for view again and can be opened in excel Print Prints the RTS summary including violations count running duration and maximum throughput Zoom In Allows you to view a smaller amount of sample time within the entire graph Zoom Out Allows you to view a larger amount of sample time within the entire graph Enable Auto Scroll When this setting is ...

Страница 155: ...e Statistics View Teledyne LeCroy 4 2 2 RTS Preferences The RTS Preferences dialog enables selection of the color and general settings Figure 4 3 Real Time Statistics Preferences Dialog Trace Information icon Click to display the Trace Information dialog ...

Страница 156: ... 3 RTS Print Clicking the RTS Print button displays the RTS summary including violations count running duration and maximum throughput It also displays the Print dialog to print the report You can choose not to print the report Figure 4 4 Real Time Statistics Brief Report On screen Display ...

Страница 157: ...t occur between activating a row and issuing a precharge to the row in same rank and same bank This makes sure that all the data from the row has been moved to the sense amps and is stable before a precharge is issued to write the data back to the row 5 1 2 V02 tRAS ACTIVATE to PRECHARGE command period Max The maximum interval between ACTIVATE and PRECHARGE to the same rank and same bank is specif...

Страница 158: ... different Banks with in this time window Activating a 5th Bank within this time window 30 50ns will cause a violation Activating the 5th Bank on the exact expiration time is valid 5 1 5 V05 tRCDx ACTIVATE to internal read or write delay same bank The minimum interval between Activate and Internal Read or Write is specified to allow sense amps time to open the selected row For systems with Additiv...

Страница 159: ... tRP PRECHARGE to a Valid Command The minimum interval between PreCharge and the next valid command is specified to ensure the active row is closed before the next valid command 5 1 9 V09 tWRA WRA to a Valid Command Defines the interval for Write Recovery READ to PRECHARGE delay Clock average Write with Auto Precharge requires that the Controller take into account the CWL column write latency whic...

Страница 160: ...d eight During Self Refresh Mode the number of postponed or pulled in REF commands does not change 5 1 12 V12 tRTR READ to READ delay DDR3 same rank DDR4 same bank group Defined as the interval between a single READ command and another l READ to the same rank and the same DIMM This is calculated based on the CAS to CAS delay tCCD which is a minimum of 4 CKs for all speed bins 5 1 13 V13 tdrRTR REA...

Страница 161: ...art of WRITE command to READ command In case of BC 4 mode the internal write operation starts two clock cycles earlier than for the BL8 mode This means that the starting point for tWR and tWTR will be pulled in by two clocks when BC 4 is used This is defined for BC 4 CWL WTR speed 2 or BL 8 CWL WTR speed 4 The formula is shown as tWTRx CWL tWTR Spec BL 2 5 1 19 V19 tdrWTR WRITE to READ delay diffe...

Страница 162: ...resh operations in progress 5 1 25 V25 tXSDLL SELF REFRESH EXIT to a Valid Command with DLL Defined as the interval between Self Refresh Exit command and the next Valid command that needs DLL Exiting Self Refresh SRX requires combination of CKE high plus NOP Deselect command asserted for at least 2 CKs Before a command that requires a locked DLL can be applied a delay of at least tXSDLL 512 CKs an...

Страница 163: ...ween Write with Auto command and initiating Power down entry This is calculated as WL AL CWL BC4 2 4 WR 1CK for all speed bins where WR CKs as programmed in MR0 5 1 33 V34 tXP POWER DOWN EXIT to a Valid Command without DLL Defined as the minimum interval between initiating Power Down Exit and the next Valid Command that doesn t need DLL Without DLL indicates DLL was not disabled during Power Down ...

Страница 164: ...ed as max 64nCK 80ns for all speed bins 5 1 38 V39 tZQOper ZQCL to a Valid Command Defined as the minimum interval between long Calibration Sequence command to next valid command This is calculated as max 256nCK 320ns for all speed bins 5 1 39 V40 tZQinit First ZQCL after Reset to a Valid Command Defined as the minimum interval between the first Long Calibration Sequence ZQCL command after reset t...

Страница 165: ...different bank group within the same Rank 5 1 44 V45 tWTW DBGWrite to Write Delay short Different bank group same rank DDR4 Defined as the minimum interval between a WRITE command and another WRITE command to a different bank group within the same Rank This is calculated as WL AL CWL tWPRE BL 2 WTW S 5 1 45 V46 tWTR DBGWrite to Read Delay short Different bank group same rank DDR4 Defined as the mi...

Страница 166: ...resh Exit command and the next Valid command that needs DLL tXS FAST is defined as tXS_FAST tRFC4 min 10ns 5 2 Supplemental Timing Information 5 2 1 tWR WR write recovery for auto precharge tWR specifies the minimum interval between the last burst write cycle and the point where the precharge command can be issued to the same bank Speed Grade 800 1066 1333 1600 1866 Min ns 15 15 15 15 15 ...

Страница 167: ...rotocol Analyzer User Manual 165 Appendix B China Restriction of Hazardous Substances Table The following tables are supplied in compliance with China s Restriction of Hazardous Substances China RoHS requirements ...

Страница 168: ...Teledyne LeCroy 166 Kibra DDR Protocol Analyzer User Manual ...

Страница 169: ...nical support US and Canada 1 800 909 7112 Worldwide 1 408 653 1260 Fax your questions Worldwide 1 408 727 6622 Write a letter Teledyne LeCroy Protocol Solutions Group Customer Support 3385 Scott Blvd Santa Clara CA 95054 3115 USA Send e mail psgsupport teledynelecroy com Visit Teledyne LeCroy s web site teledynelecroy com ...

Страница 170: ...Teledyne LeCroy 168 Kibra DDR Protocol Analyzer User Manual ...

Страница 171: ...7 Check for Updates 97 Goto Next Transition 114 Goto Previous Transition 114 Clock Position Selection 103 Clock Present trigger 65 Clock Based Timing 11 CMD ADD CNTRL Bus and Process JEDEC Protocol 11 Command Filter Out 51 Command Triggers 61 Common Features of Bank State View and Waveform View 134 components 9 Configuring Visible Banks 134 Connecting 14 connectors 13 contact 167 creating markers ...

Страница 172: ...24 launching software 24 Launching the CrossSync Control Panel 71 LEDs 13 Lines Properties tab 75 76 Listing View 130 actions 130 Listing View icon 33 Listing View tab 79 M Main Toolbar 32 Main Window 31 Manual Trig button 38 Manual Trigger 33 38 manual trigger 38 Manual Trigger Mode 38 memory recording 13 Memory Address Mapping tab 66 Memory Controller pane 47 menu analysis 84 help 96 navigation ...

Страница 173: ... tab 78 80 82 Shortcut List 97 signal names 119 Slot 1 Interposer with DIMM 18 Slot 2 Interposer 19 Snap to Edge 105 Snapshot 38 Snapshot Mode 38 Software Installation 14 software installation 14 Software Menus and Toolbar 32 software overview 28 specifications 13 Speed 48 Start icon 32 Stop icon 32 storage range 13 STX SYNC Expansion Card In Out data ports 12 support 167 switches 13 Symbol Colori...

Страница 174: ...otocol Analyzer User Manual W Waveform View 103 actions 119 Waveform View Context Sensitive Menu 109 Waveform View icon 33 Waveform View tab 78 80 82 web site 167 Website CATC 167 weight 13 Windows 95 Z Zoom Box 107 Zoom In 106 Zoom Out 106 ...

Отзывы: