background image

Pulse Pro

fi

ling Application

part of a pulse. The pulse criteria de

fi

nes the edges of the positive portion of the

entire pulse and is relative (or added) to the measurement threshold if threshold is
enabled. It is relative to the noise

fl

oor if the measurement threshold is disabled.
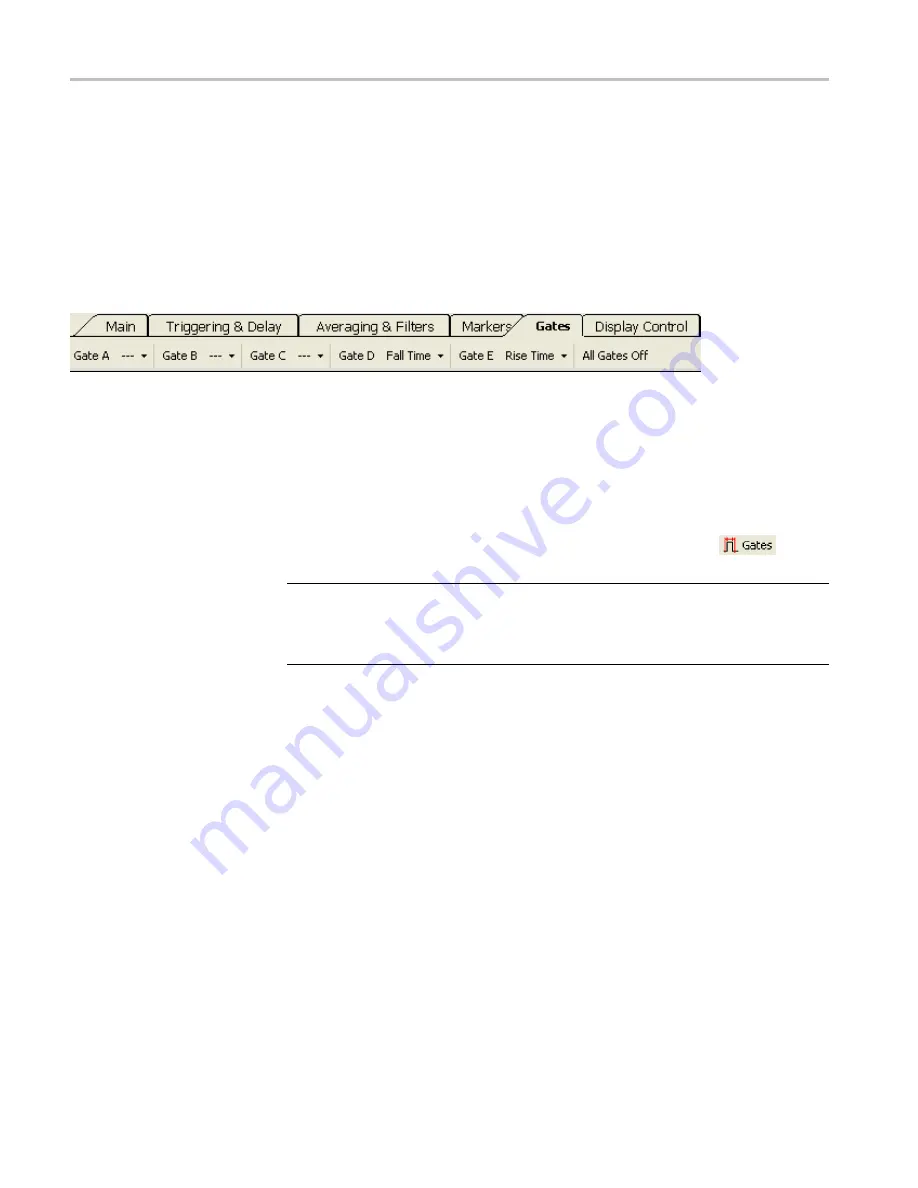
Gates

The time gates allow you to characterize the incoming signal. Rise time, fall time,
and droop measurements are very sensitive to the position of the gates. These
measurements use the position of the gates as starting and end points for the
measurement. (See page 42,

Gate Measurement Types in Gates Toolbar

.)

Gates A through E.

There are

fi

ve time gate pairs (A-E). The drop down menu for

each gate allows you to set measurement type and gate position.

You can then select Set Position from the gate drop down menu to access the

Set

Position

window to place the gate. You can also place the gate by clicking in

the Panoramic Trace window.

To move or place a particular gate, the Pointer Control mode (found in the Display
Control toolbar and in the Results window) must be set to Gates (

).

NOTE.

Only one gate can be active at a time, though all

fi

ve gates can be

displayed simultaneously. The active gate will have an asterisk (*) next to its
letter in the toolbar and the gate letter will be underlined and appear slightly
larger in the trace display.

The following general gate positioning diagram shows where to place the gates
for the various measurement types. (See Figure 4.)

Gate Measurement Types

in Gates Toolbar

The time gates allow characterization of the pulse signal to include the following
parameters, selectable in the Gates toolbar from the Gate drop down menus. You
can also make all of the following measurements automatically by clicking the

Start Measurement

button in the Auto Measure window.

A brief description of every measurement follows. After the list of measurements,
there are some measurement examples that guide you through the gate setups.

Rise Time (RT).

Returns the time required for the signal to increase in amplitude

from 10% to 90% of the amplitude de

fi

ned by the placement if the right-most gate.

RT is measured on the

fi

rst complete pulse: the left gate determines the start of

data and the right gate marks the highest point to be considered.

42

RF and Microwave Power Sensors/Meters

Содержание PSM3000 Series

Страница 1: ...xx PSM3000 PSM4000 and PSM5000 Series RF and Microwave Power Sensors Meters ZZZ User Manual P077059201 077 0592 01...

Страница 2: ......

Страница 3: ...PSM3000 PSM4000 and PSM5000 Series RF and Microwave Power Sensors Meters ZZZ User Manual xx www tektronix com 077 0592 01...

Страница 4: ...and pending Information in this publication supersedes that in all previously published material Specifications and price change privileges reserved TEKTRONIX and TEK are registered trademarks of Tek...

Страница 5: ...es taxes and any other charges for products returned to any other locations This warranty shall not apply to any defect failure or damage caused by improper use or improper or inadequate maintenance a...

Страница 6: ......

Страница 7: ...se Measurements 15 Pulse Profiling 16 Configure Instrument for Measurements 17 Power Meter Application 19 Front Panel Elements 19 Make an Average Power CW Measurement 27 Make a Pulse Measurement Using...

Страница 8: ...ng a PSM5120 19 Figure 2 Diagram of a burst time slot 23 Figure 3 Pulse Profiling application interface 31 Figure 4 Gate positioning diagram 44 Figure 5 Position of gates for measurement 51 Figure 6 H...

Страница 9: ...Contents List of Tables Table i Product documentation vii Table 1 Functions by instrument model 13 Table 2 Power Meter default values 25 Table 3 Sweep time values 37 RF and Microwave Power Sensors Me...

Страница 10: ...Table of Contents iv RF and Microwave Power Sensors Meters...

Страница 11: ...M3000 Series PSM4000 Series and PSM5000 Series RF and Microwave Power Sensors Meters The Getting Started chapter provides an overview of instrument features installation instructions and a functional...

Страница 12: ...0 50MHz 18GHz N Type male PSM4410 50MHz 20GHz 3 5mm male PSM5110 100MHz 8GHz 3 5mm male PSM5120 100MHz 8GHz N Type male PSM5320 50MHz 18GHz N Type male PSM5410 50MHz 20GHz 3 5mm male Key Features Read...

Страница 13: ...ion configuration and application information User manual this manual available in English German French Spanish Italian Portuguese Russian Korean Japanese Simplified Chinese and Traditional Chinese o...

Страница 14: ...Preface viii RF and Microwave Power Sensors Meters...

Страница 15: ...recommends using the USB cable supplied with this product The supplied cable has 20 AWG power conductors that are a heavier gauge than most USB cables NOTE Refer to the Specifications section of the...

Страница 16: ...er measurements High speed Logging application allows you to take raw high speed readings from your instrument Pulse Profiling application PSM5000 series only provides the tools for complete character...

Страница 17: ...d start automatically If the installation does not start automatically select Start Run and the media drive and a semicolon D for example and then setup exe or the location of the setup exe file you d...

Страница 18: ...continue 5 The installer is ready to install the following software on your computer this will vary depending on options and instrument model Power Meter application Pulse Profiling application High S...

Страница 19: ...Getting Started 6 Confirm location for download or provide a location and then click Next 7 When prompted confirm installation by selecting Next RF and Microwave Power Sensors Meters 5...

Страница 20: ...Computer Install the USB Driver This instrument is powered through a USB cable that you attach to a computer Use the following procedure to install the USB driver so that the computer can communicate...

Страница 21: ...ment to the computer 2 A Welcome to the Found New Hardware Wizard dialog box will appear Select Yes this time only and then select Next to continue 3 Select Install the software automatically Recommen...

Страница 22: ...e software Once found the driver will install 5 The Wizard will show you when the installation is complete Select Finish You can now open the Power Meter application or other instrument applications t...

Страница 23: ...o the instrument but that the instrument has not yet been recognized by the computer Bright green and steady This is the state for normal operation and shows that power is being supplied to the instru...

Страница 24: ...bar To identify which instrument corresponds to which software window compare the serial number displayed in the software to the serial number stamped on the instrument body below the USB port Or cli...

Страница 25: ...Turn on and preset a signal source 3 Turn the source RF output off 4 Connect the source to the instrument input connector Use adapters as required Use of cables may skew results so direct connection...

Страница 26: ...Getting Started 12 RF and Microwave Power Sensors Meters...

Страница 27: ...e 1 Functions by instrument model Function Model Description PSM3110 10 MHz 8 GHz 55 to 20 dBm PSM3120 10 MHz 8 GHz 55 to 20 dBm PSM3310 10 MHz 18 GHz 55 to 20 dBm PSM3320 10 MHz 18 GHz 55 to 20 dBm A...

Страница 28: ...pulses These models can both be used with the Power Meter and the High Speed Logger applications In both applications you can select between CW average and Pulse measurements In addition to pulse powe...

Страница 29: ...on and sampling system in these instruments make it possible to measure signals with modulation rates up to 10 MHz The real time sampling rate of PSM4000 and PSM5000 series instruments is 500 kS s whi...

Страница 30: ...s and conditions apply digital filters to the envelope and set the software to average traces together The overall trace is shown in the Panoramic Trace window Pan and zoom functions let you select a...

Страница 31: ...ent the software application will close Disconnect and then reconnect the instrument before reopening the application The new address will appear for that instrument Zero and Calibration These power s...

Страница 32: ...Operating Basics 18 RF and Microwave Power Sensors Meters...

Страница 33: ...r 3 15 VRMS Ensure that the RF input connector on the sensor and the mating connector are clean and undamaged NOTE Using more than one type of application at a time can result in errors It is recommen...

Страница 34: ...menu item is found in the Save Recall drop down menu It calls a Manage Named states window from which you can delete and view named states Frequency Select the frequency units MHz or GHz The center f...

Страница 35: ...layed If averaging is set high then the display updates slowly Extended Averaging Reset You can combine Averaging and Extended Averaging to balance stability and responsiveness for your application an...

Страница 36: ...se correction factors are specified as frequency and amplitude pairs To load the correction factors go to the Frequency Response Offset window Click Add after each frequency and offset entry to build...

Страница 37: ...The sweep time defines the duration of the measurement Resolution The power measurement data is taken at the real time sample rate of the instrument which is 500 kS s This results in a fixed resoluti...

Страница 38: ...m will time out and return an ext trig indicator When the trigger in is inverted the system will look for a negative edge instead of a positive edge and begin the measurement when a negative edge is d...

Страница 39: ...left The duty cycle is scaled vertically from 0 to 10 1 per division Crest Factor is scaled vertically from 0 to 20 dB 2 dB per division NOTE There is a separate High Speed Logger application availab...

Страница 40: ...times This is particularly useful when multiple instruments are connected You can also find this item in the Utility drop down menu Set Address This item is located in the Utility drop down menu Use i...

Страница 41: ...activate CW mode You can also enable CW from the Measurement menu NOTE For PSM3000 series instruments the software is always in CW mode so the button is not available 2 Click Measurement Set Frequency...

Страница 42: ...ed a duty cycle of 10 0 10 then the pulse power would be calculated as Pulse Power 20 dBm 10log10 Duty Cycle 20 dBm 10 dB 10dBm NOTE The instrument must be in CW Power mode to access this method of du...

Страница 43: ...he Set Frequency dialog box opens 3 Enter 1 GHz and click OK 4 Confirm that the instrument is set to continuously trigger and then click Triggering Internal Continuous In Pulse Power mode the software...

Страница 44: ...RF power The software should indicate these approximate values 1 GHz 0 dBm pulse power 50 duty cycle 0 dBm peak 3 dBm average 3 dB crest factor the ratio between peak and average power The measurement...

Страница 45: ...lays a trace of the pulse envelope and allows you to take measurements at any point on the trace CAUTION Do not exceed 23 dBm 200 mW or 3 15 VRMS Ensure that the RF input connector on the sensor and t...

Страница 46: ...you identify and investigate areas of interest easily and quickly To view a portion of the Panoramic trace in more detail highlight the portion of the trace in which you are interested The highlighted...

Страница 47: ...the capabilities of your printer For all of these displays you can set the resolution data source trace or gates minimum and maximum power and the number of data sets or runs with counter See page 16...

Страница 48: ...on to start the automatic measurement feature and get a complete characterization of the pulse based on the selected sweep time Results Window This window allows you to set up markers and gates for sp...

Страница 49: ...ge power while the pulse is on to the average power while the pulse is off during the first complete cycle NOTE The Auto Measurement feature requires at least two complete cycles of the pulse to be vi...

Страница 50: ...nd that area of the display will become highlighted NOTE You can also place a window anywhere on the display without using the docking popup Simply click and drag the window to the desired location an...

Страница 51: ...um value displayed in the Panoramic and Measurement windows It also allows you to change the vertical scale in the Measurement window The vertical scale setting only applies to the Measurement window...

Страница 52: ...at do not fit into the trace are not averaged but are discarded Activating this function will tend to increase the noise on the trace but it improves the ability to see peaks For sweep times of 200 ms...

Страница 53: ...et the trigger level when the trigger source is set to Internal Manual Level Edge Use this menu function to set the instrument to trigger on a positive or negative edge Continuous Use this menu functi...

Страница 54: ...on allows you to choose from one two three or four poles The number of poles determines the roll off rate of the low pass video filter The greater the number of poles the steeper the roll off resultin...

Страница 55: ...he following NOTE There is a procedure in this document for making a measurement using markers See page 48 Make a Marker Measurement Arrow Icons The arrow icons allow you to position the markers on a...

Страница 56: ...ust be set to Gates NOTE Only one gate can be active at a time though all five gates can be displayed simultaneously The active gate will have an asterisk next to its letter in the toolbar and the gat...

Страница 57: ...me restrictions as the PRT measurement Duty Cycle DC Returns the percentage of on time during a selected cycle The gates for a duty cycle measurement must be positioned with the same restrictions as t...

Страница 58: ...lse width pulse repetition time pulse repetition frequency Mixed Set peak power crest factor pulse width pulse repetition frequency Below is a general gate positioning diagram that shows where to plac...

Страница 59: ...play These icons are also available at the top of the Results window Display Options This toolbar allows you to adjust how the trace windows and other windows are viewed For example you can adjust the...

Страница 60: ...o select color themes for the display from a drop down menu Grid On Off This button allows you to turn the Panoramic and Measurement Trace window grids on and off Meas Notation On Off This button allo...

Страница 61: ...lications like Excel for further analysis Utility This toolbar enables you to set the instrument address and verify instrument ID It also allows you to perform two types of reset default setup and fac...

Страница 62: ...ments are normally defined as the time between the 3 dB points on the rising and falling edges of a pulse When using markers for a measurement like this the results are highly dependent on the placeme...

Страница 63: ...lues are shown in the Results window 9 Click All Mkrs Off to turn off the markers when you are finished Make a Gated Measurement Follow this procedure to set up the gates based on the example input us...

Страница 64: ...c measurements such as duty cycle and frequency a Click on the left gate in the Measurement window and move it to the left until the rising edge of the pulse is positioned to the right of the left gat...

Страница 65: ...the selection of measurements that can be made You can also right click on the gate in the Results window A dashed line will appear if the gate cannot take a measurement or is not set You can compare...

Страница 66: ...that the RF input connector on the sensor and the mating connector are clean and undamaged When you first open the High Speed Logger Application a window will appear asking if you would like to initi...

Страница 67: ...his button to initialize the instrument When initialization is complete a dialog box will appear stating so Help Click this button to open the online help file for this application It is in a PDF form...

Страница 68: ...ication The application also allows you to select the format of the files you save tab or comma delimited Tab delimited works well with spreadsheet applications like Microsoft Excel 54 RF and Microwav...

Страница 69: ...t type units and frequency In order to get accurate measurements you will need to set the frequency If CW is selected only the average or continuous wave power is recorded If Peak pulse is selected th...

Страница 70: ...nt proceeds The threshold is specified in dBm External TTL Trigger Clicking start causes the application to monitor the external TTL trigger input When a trigger occurs measurement will begin Only the...

Страница 71: ...this window with one of the following options Stop button Click the stop button to stop the measurement Time expires Specify the time in milliseconds when the measurement will stop Points measured Sp...

Страница 72: ...of points causes a stop in measurement As stated above many factors can negatively impact this rate Again these affects tend to be modest in most cases and pose little concern In addition the resolut...

Страница 73: ...he name of the file should include the date and time Troubleshooting Memory Errors This application can generate a large amount of data and can consume significant amounts of memory and disk space Thi...

Страница 74: ...High Speed Logger Application 60 RF and Microwave Power Sensors Meters...

Страница 75: ...ended averaging 21 F Factory recall 48 Factory setup recall 26 Fall time measurement 43 Filtering poles 40 Frequency 20 36 center the 17 Frequency response 22 Front panel virtual Power Meter 19 Functi...

Страница 76: ...Display Control toolbar 44 Reset Max 21 Response 37 Results window 34 Rise time measurement 42 S Safety v Sample code 2 Save 20 Sensor ID 47 Set address 26 48 Set Ref 22 Setup quick 25 Single button...

Отзывы: