


11Beamage-3 User
’s Manual Revision 4.0
52
Standa Ltd. All rights reserved
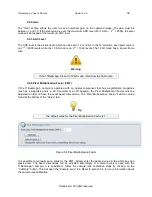
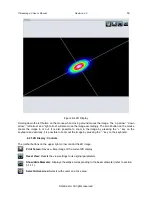
1/e
2
:
Shows/Hides the level corresponding to the 1/e
2
value.
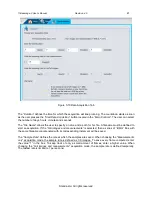
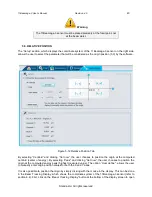
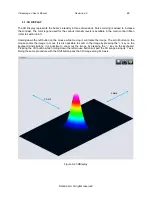
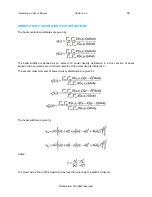
6.3.2. Gaussian Fit
The
“Gaussian Fit”
function fits the best Gaussian c
urve on the experimental data. When the “
Gaussian
Fit”
is activated, it displays three information on the graphic’s upper right corner.
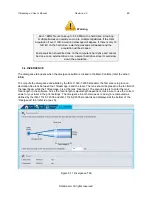
1.
The Gaussian equation
The first information to be displayed is the equation of the fitted Gaussian. The Gaussian equation is
defined by:
where
w
is
the beam’s radius,
c
its centroid.
2.
The Gaussian Fit factor
The Gaussian Fit factor is defined as:
where
E
is the experimental curve and
E
a
is the theoretical Gaussian curve.
The closer to 100%, the better the Gaussian fit.
3.
The Roughness Fit factor
The Roughness Fit factor is the maximum deviation between the theoretical Gaussian curve and the
measured curve, as defined by ISO13694:2000
2
:
where
E
is the experimental curve and
E
a
is the theoretical Gaussian curve.
The closer to 0%, the better the Gaussian fit.
2
International Organization for Standardization,
ISO 13694 :2000 Laser and laser-related equipment
–
Test methods for laser beam power (energy) density distribution, Geneva