22
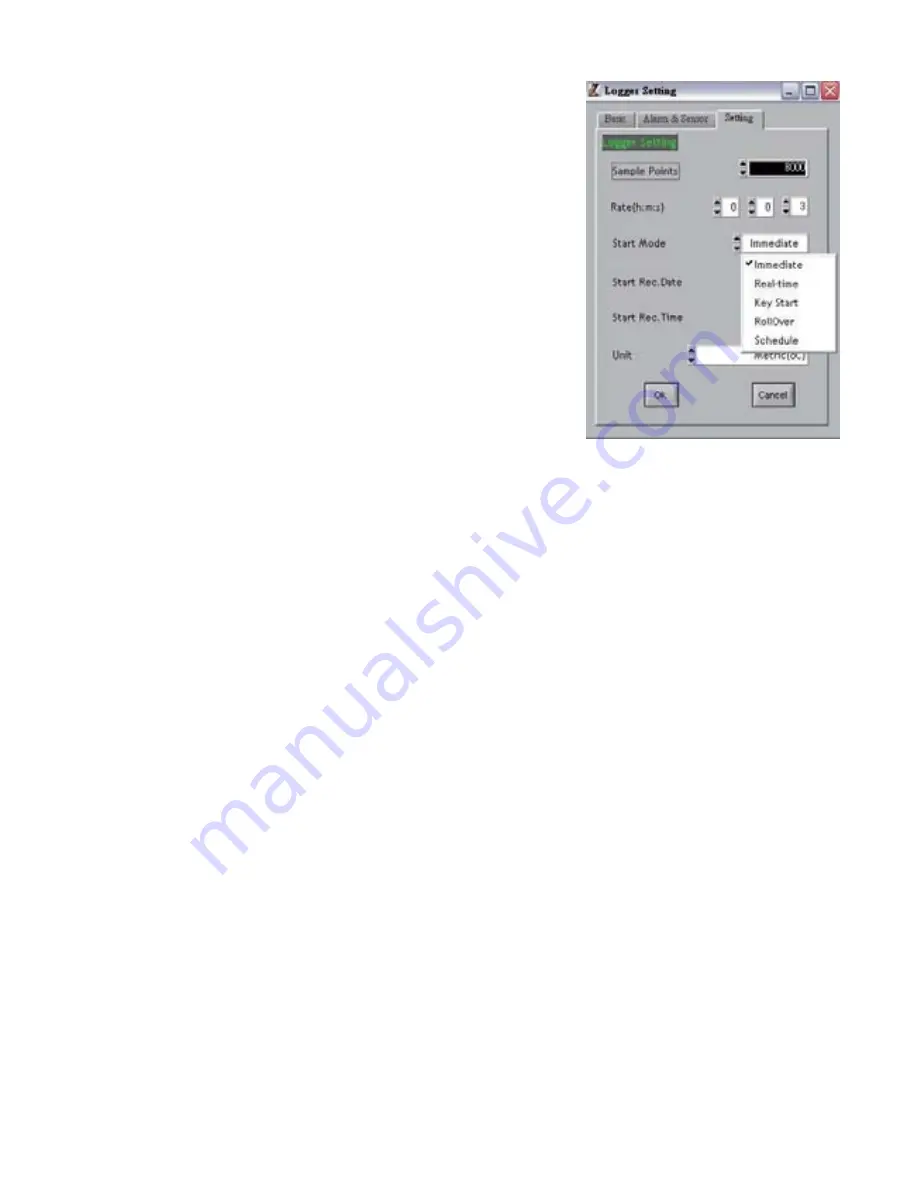
Setting Roll Over Mode
This option allows for continued
recording even when the monitor is
full. After the data limit has
been reached new readings will
be recorded over the earliest record.
1. Adjust the ▲or ▼indicators to
specify the number of sample
points, in thousands, from 1000
to 32,000.
2. Adjust the ▲or ▼indicators to toggle between units:
°C or °F.
3. Select “Ok” to save the settings and exit the menu, or
“Cancel” to exit without saving the new settings.
(Pic.1)
(Pic.2)
Manual set COM port:
If software message box shows as Pic2. Follow the steps below:
1.Click My computer
Content in hardware content,click Device
“
””
”
“
manager to find the listed (COMx) listed under Ports(COM & LPT as
”
below with red line. If you may Prolific USB-to-Serial Comm. Port , it
means the logger is connected to computer properly.
11
2. Remember the Comm port number and go back to software.
3 Click “Setting” ”Comm port “ select the port number as you see from
.
step 1, then press OK button.
Logger Setting
(98536.98537.98538.98539 only)
:
(Pic.4)
(Pic.3)
(Pic.5)
2:Current Date/Time
Clock setting, the system automatically shows current date and time of your pc.
Press OK to confirm.
(Note :Schedule date & time refer to current pc date and time)
►Please click OK to sync the meter’s date and time every time.
3 LCD display set
:
(N/A for non-LCD models)
ALARM&SENSOR:(Pic.4)
1.Please set CO high alarm on meter manually.
2
2.The parameter sensor is default.
BASIC:(Pic.3)
1:ID setting
Maximum 20 characters , name your logger press OK button to confirm.
12
SETTING:(Pic.5)
1 Set sample point (K=1,000 multiple basis within total memory points)
:
2. Select Unit : Select Temperature unit °C/°F,press OK to confirm.
( B ) Schedule start mode:
Select the date and time meter will start recording.
Please follow the date and time form (M/D/Y,H:M:S)
3 .Set sample rate, start mode to record:
Select “hour(1~6), “minute(0~59)”,“second(0~59)” time interval.
Select 5 start modes from:
(A)Immediately
(B)Schedule
(C)Real-time (PC is always connected with the logger unit)
(D)Key start (Start recording by pressing button)
(E)Roll-over (when memory are full, logger covers the earliest memory
automatically)
( C )Real-time start mode
:
1.After set start mode at real-time,datalogger starts login records. When logger
records, the green fan at left corner shows it is under recording.(Meter should
be connected with pc all the time,under this mode.)
2.In real-time mode, it shows “STOP” button instead of “DOWNLOAD”
at the right corner. Press QUIT to stop real-time recording.
►Before exit software data has to be saved.
( D ) Key-start mode:
Select the mode to record once long press
button ,
press
SEL/R
SEL/R
long
button again to stop recording. Data has to be downloaded before next key-start.
After key off the recording, the data has to download before restart the
NOTE:
Key-Start function.
(E) Roll-over mode:
Select the mode to record when the data is full, it will cover the earliest memory.
After download the data , long press grey button to record without reset up each
parameter and selection.
Retrieve file:
Press RETRIEVE FILE button to select file and show the graph.
LOGGER Status:
Before download data, press
to show ID, Records, Sample rate,
LOGGER status
Unit.
NOTE: Once
button is pressed, recording is inactivated.
Download
Logger function:
Download data:
Press DOWNLOAD button, data download in few seconds. Graph shows
automatically
Please do not press DOWNLOAD button if you won’t stop record.
NOTE:
You can press LOGGER STATUS button to see record points.
Save data:
Press SAVE button to save txt.file.
13
View Data Table
:
Press View button to get data table with details.(pic.6)
Long press
(pic.7)
√
√
(pic.8)
(pic.6)
Print graph:
Press PRINT button and print graph. Follow the print
setting below to print full screen graph. Press OK to
print pdf file.(pic.7)
Print Table Data:
Press table data, the screen shows the record range,
enter the start number to the end number (For
example: 1~500 or 200~1000...or leave it blank for
printing all data ).(pic.8)
Save each pdf. files with different names.
14
Zoom in/out&Move
=
Screen graph zoom in
=
Ctrl
+
Screen graph zoom out
Mouse
Hold
Click
Shift
Click
Mouse
=
Move screen graph
Mouse
Press
or
= Read each measurement .
NOTE: If the graph size is over zoom in/out,follow the color select below
the graphic will go back to default size
Ctrl
+
Hold
Click
Ctrl
+
Hold
Line color selecting:
1.Click the color beside the reading(Temp. RH), color box shows
below.
2.Move mouse to review and select color.
3.Click to save, the color appear on line and bar.
Содержание 800048
Страница 1: ...1 IAQ Monitor Datalogging IAQ Monitor 800048 800049 Instruction Manual ...
Страница 6: ...6 FRONT PANEL DESCRIPTION LCD DISPLAY 1 2 3 4 5 6 7 8 9 10 11 12 ...
Страница 14: ...14 ...
Страница 15: ...15 Appendix Datalogging IAQ Monitor 800049 ...


