User Guide
Battery Discharge Graph
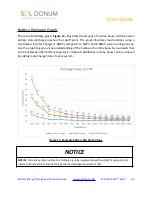
The rate-of-discharge graph,
Figure 14.
, illustrates the amount of runtime hours until the Vulcan
battery state-of-charge reaches the cutoff point. The graph illustrates load runtimes using a
standalone Inverter-Charger (1.4kWh) compared to 5kWh and 8.6kWh system configurations.
Use the graph to gain a visual understanding of the number of runtime hours by load watts that
can be achieved when battery capacity is increased. Additional runtime hours can be achieved
by adding more Energy Stores to your system.
Figure 14. Example battery discharge times.
NOTICE
NOTICE
: Calculate system runtimes by multiplying Vulcan system kilowatt hour (kWh) capacity by its
inverter efficiency (0.92) and dividing by the load wattage requirement (W).
Battery Energy Storage and Power Solutions
© Sol Donum
™
2022
35

