Scanner
Working with Data (PIDs)
32
4.6.6 About the Data Buffer
The diagnostic tool has the capability to collect, store and save PID data utilizing
internal buffer storage memory.
When data is displayed onscreen, it is automatically stored in buffer memory. The
data buffer runs continuously (storing data) until the Pause, Clear, or Save icon is
selected. All PIDs displayed in the list will be stored, not just those displayed.
Buffer memory is limited to a predetermined “total” size. When buffer memory
reaches it’s full capacity, the data buffer will continue to store new data, however
earlier stored data will be removed to allow room for the new data being stored.
The most recent data is always available for review when Pause is pressed, and
can be reviewed using the toolbar controls.
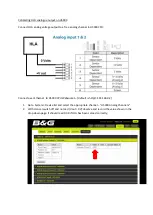
Figure 4-20
1— Data Buffer Scale
- Displays maximum data buffer size (e.g. 4000) across
screen
2— Data Buffer Indicator
- Bar graph indicates total data stored in the memory
buffer. Includes blue and white graph bars and active position indicator.
3— Blue Graph Bar
- Stored data not displayed onscreen
4— White Graph Bar
- Stored data displayed onscreen
5— Active Data Position Counter
- the numerical position of the active
(current) data point as displayed within buffer memory.
6— Maximum Data Buffer Size
(Data Buffer Position Counter)
- indicates the
maximum data buffer size value (e.g. 4000)
7— Active Data Position Indicator
- Round icon indicates active (current)
position in the data, which is also denoted by the Active Data Position
Counter.
shows the relationship between the (Blue) Current Position Cursor,
Active Data Position Indicator and Active Data Position Indicator during data
review.
Figure 4-21
3
4
7
5
6
2
1