


Operating the Sunny Island
SMA
Solar Technology AG
94
SI2012_2224-TEN082311
Technical Description
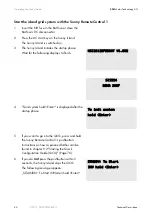
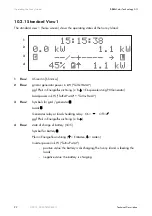
Row 1
The bar shows the charge state of the battery
in [%]
The value of the charge state is also shown
digitally on the right.
Row 2
The bar shows the magnitude of the totall
output power in [kW] with which the
consumers are being supplied.
The arrow to the right, next to the
describes
the direction of energy flow:
•
‡
Loads are being supplied
•
†
Sunny Boy (PV inverter) feeds into the
grid
The magnitude of the total output power [kW]
is also shown to the right digitally.
Row 3
The bar shows the magnitude of the power
drawn fromt the grid/generator in [kW].
The arrow to the right, next to the describes
the direction of energy flow:
•
‡
The island grid system is being
supplied by the grid/generator
The magnitude of the total power [kW] is also
shown to the right digitally.
Row 4 (status bar)
The following information is shown in the
status bar (from left to right):
1. Device hierarchy
•
M1
= Master
•
S1
= Slave1
•
S2
= Slave2
[¿¿¿¿¿ ] 50%
‡[¿¿¿¿ ] 1.0kW
M1
¿ ‡ ‡ * oo !
‡[¿¿¿¿¿¿¿¿¿ ] 1.9kW


