background image

Driver Report


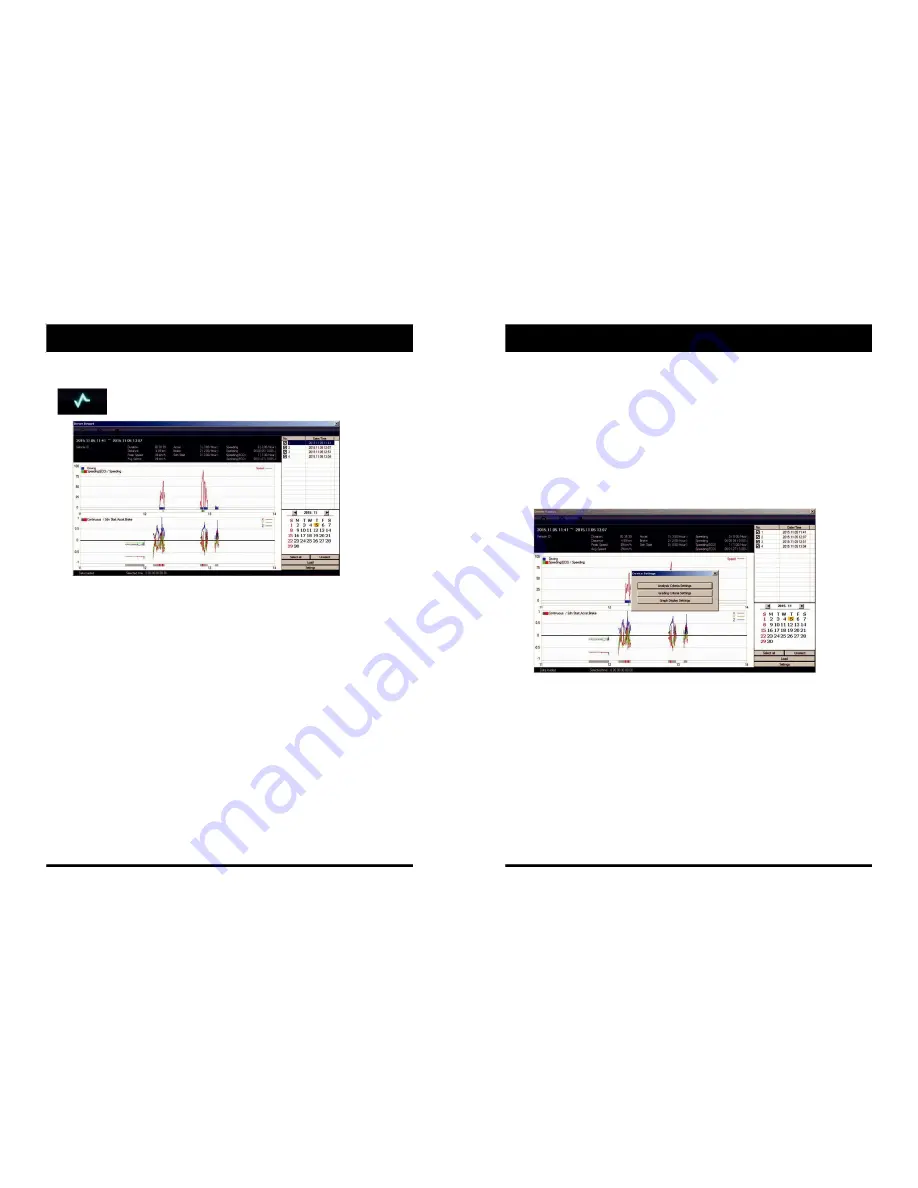
During the viewing, click the “Driver Report” icon to view the below Driver 

Report Screen.


“Driver Report” icon


From the calendar in the bottom right corner, choose the date you wish to inspect 

among the dates highlighted in blue. Dates that are not highlighted in blue, do not 

have the relevant data.


All data from the selected date will be automatically chosen from the


selection on the right. You can unselect data that you do not need. When data 

is selected, click the ‘Load’ button to load the data.


A summary of information can be found on the top of the window including; 

vehicle ID, user ID, total duration and total distance. In addition you can analyze 

the number of over‐accelerations, over‐decelerations, sharp turns, over‐

speeding, over‐RPMs that exceeded the pre‐set limit.


Top Graph


The top graph shows the speed (red) and below are three indicator bars that 

show driving patterns. The first bar shows driving (blue) and idling (grey) and 

the second bar shows the speed.


White means that the vehicle was within both the permitted speed and eco‐speed 
limit, green means above eco‐speed but within permitted speed limit, and red means 
above the legal speed limit. The last bar shows the state of the engine where white 
means the engine is off, blue means it is running properly within the pre‐set RPM limit, 
and red means over acceleration, i.e. exceeding the pre‐set RPM limit.


Analysis Criteria Settings


Bottom Graph


The lower graph shows the G‐sensors. The x‐axis is in red, y‐axis in blue, and 

z‐axis is green.


The indicator bar below shows jolts in the G‐sensor values, i.e. G‐sensor 

values that exceed the pre‐set limit. Grey means normal conditions, red 

means jolts in the x‐axis direction, blue in the y‐axis direction, and green in 

the z‐axis direction.


Configurations for this function can be set by clicking the [Setting] button in 

the right bottom corner. The limits for G‐sensor, permitted speeding, 

excessive RPM, and eco‐speeding can be set under the ‘Analysis’ tab and 

ranges for the two graphs can be set under the ‘Component’ tab.


Содержание SW2300

Страница 1: ...r purchasing the SW2300 Vehicle Recorder Please ensure that you read and understand this USER GUIDE and use it before connecting and installing this Recorder Please store the USER GUIDE in an easily a...

Страница 2: ...Viewer Software Viewing Settings 17 Open the SD card 18 Playback 19 Log File Playback 20 Save JPEG and AVI File 21 Print Image 22 Backing up Files 23 GPS Log to KML Converter 24 Driver Report 25 Anal...

Страница 3: ...gs to improve GPS reception The commercial purpose GPS has the average rage error of more than 15 meters and the range error could be more than 100 meters due to environmental conditions like building...

Страница 4: ...4...

Страница 5: ...NTENTS INTRODUCTION FRONT Bracket Camera Lens SW2300 Lock Vehicle Recorder Power Cable Sticker for Windscreen mounting SD Wire Splice clips x5 Memory double sided tape x1 Card Slot Left side Right Sid...

Страница 6: ...5 6...

Страница 7: ...charge Thereafter the internal flash memory will be ready to record Continuous Record When Record mode set as Continuous This is the default mode for recording In this setting the unit will begin rec...

Страница 8: ...on SD un mount Press the Blue button for 3 seconds and release it then the Blue LED will stay on all the time Now you can take out the SD memory card SD reset Press the Blue button for 3 seconds and r...

Страница 9: ...9 10...

Страница 10: ...illar trim The VT1000 requires a continuous 12 24volt power source from the vehicle The cable supplied will allow you to hard wire the SW2300 unit to the fuse box of your vehicle Connect the red cable...

Страница 11: ...ill be displayed on your desktop NOTE To Un install the PC Viewer Software Make sure the program is not running and open the Control Panel Select Remove Program and remove the PC Viewer Software INITI...

Страница 12: ...13 14...

Страница 13: ...nic button has been pressed G Sensor Sensitivity The shock sensor sensitivity can be set to Simple setting Mode or Custom Set to easy allows you to set the sensitivity to 9 High 5 Medium or 1 Low In c...

Страница 14: ...15 16...

Страница 15: ...e formats can be changed with this Viewing settings Video Flip Video Mirror Brightness and Contrast can be set in this Viewing Settings Open the SD card Insert the SD card into your PC Click Select SD...

Страница 16: ...otal log data size can be set from 2 days to 31days The log data overwrites the oldest data Using this log data you can use the data sorting function which helps to find a specific data like more than...

Страница 17: ...icon to make an AVI file Save AVI icon Print Image Pause the playback and click Print Image icon Print Image icon Choose to print the current image or select another image from the same file you are...

Страница 18: ...21 22...

Страница 19: ...tion GPS Log to KML Converter To see the whole route on Google Earth select the log file and click the Google Earth icon as shown below STEP 1 Install Google Earth on your PC http www google com earth...

Страница 20: ...ving blue and idling grey and the second bar shows the speed White means that the vehicle was within both the permitted speed and eco speed limit green means above eco speed but within permitted speed...

Страница 21: ...25 26...

Страница 22: ...the drop down menu In the example the limit has been set to 60km h for 10 seconds If this limit is exceeded it will count as excessive Grading Criteria Settings The criteria for grading driver s safe...

Страница 23: ...e 12 5 they would be graded as A The assessment of this criteria is based on the eco speed limit option in the Analysis Criteria Setting This criteria is used for eco grading only Grading Criteria Set...

Страница 24: ...29 30...

Страница 25: ...100 Speeding Count 20 A 100 C 70 Speeding Duration Ratio 10 C 70 A 100 Peak Speed Relative to Speed Limit 10 A 100 A 100 Average Speed Relative to Speed Limit 10 A 100 A 100 Excess Eco speed Count 91...

Страница 26: ...31 32...

Страница 27: ...S Internal GPS GLONASS G Sensor Internal 3 axis G sensor RTC Internal battery Buzzer Recording start error Audio Internal Microphone LED Record Blue LED Warning Red LED Supper Capacitor Enable recordi...

Страница 28: ...33 34...

Страница 29: ...es about 30 seconds Warning Do not turn off the power during upgrading If the upgrade fails the SW2300 unit should be returned to your local distributor Once the upgrading is finished the unit will au...

Страница 30: ...35 3...

Страница 31: ......

Страница 32: ......

Отзывы: