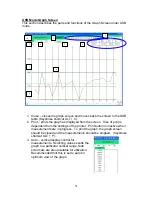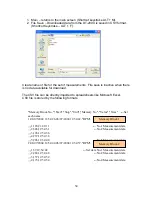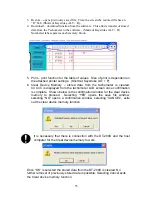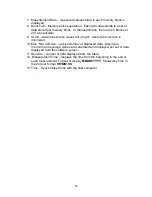
4. All – horizontal display control, time axis.
Setting Explanation
All
It automatically sets time present while the
measurements are in progress. It is also the time after all
measurements are stopped.
Limit
Setting Limit of the USB main screen
The same range setting is set to “All” when Limit is set to
0.
10sec.
100sec.
300sec.
Selectable time range of each value, optional scroll bars
are provided for manual view.
5. Tab – numbered tabs separate sets of data captured from the tachometer.
Each set has a corresponding graph that can be viewed from the USB
Graph Screen.
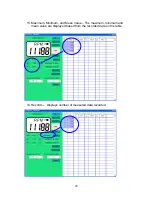
6. Measurement data – horizontal line tracing the measured values as it
occurs. This green line is always changing, based from the changes in
measurement.
7. Maximum Value Bar – horizontal line tracing the maximum value
measured.
8. Minimum Value Bar – horizontal line tracing the minimum value measured.
9. Max, Min, Average Value Bar – Small table located on the upper left hand
corner of the graph. This bar is a quick summary of the maximum,
minimum and average values of the data measured.
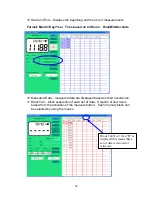
10. Time – Time recorded when the measurements took place. Format as
follows: MM/DD/YYYY, followed by time in 24-hour format HH:MM.
52


