


RF Explorer Pro Audio Edition User Manual
page 14
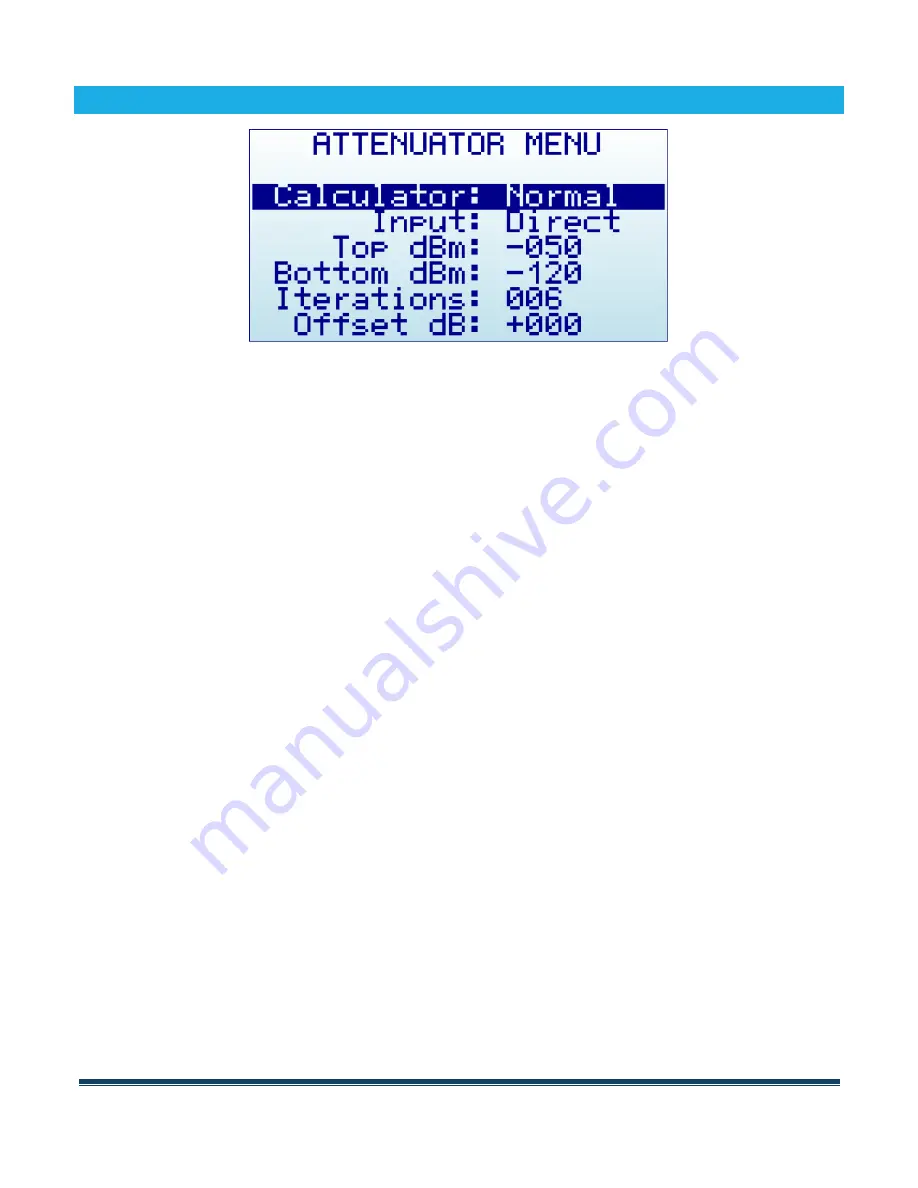
ATTENUATOR MENU
•
Calculator
: internal DSP calculator mode
•
Input
: select input stage to enable LNA or Attenuator
•
Top dBm
: Visual max amplitude on screen.
•
Bottom dBm
: Visual min amplitude on screen.
•
Iterations
: Internal DSP calculator iterations.
•
Offset dB
: external dB attenuation or gain value to compensate for external devices, such as attenuators or
amplifiers.
•
Units
: dBm or dBuV.
Note you may need to navigate all the way to the bottom for the menu to show this last
option on screen
.
The selected Top and Bottom dBm are visual limits, not real internal limits.
The internal DSP optionally performs advanced calculations in order to configure the analyzer for the required
measurement:
•
Calculator
offers multiple modes to display data, to change mode click on [Enter] key:
o
Max
: Peak values are used from the last sweep Iterations (see menu option at the bottom). This is the
standard mode you will want to use to detect rapidly changing DSS signals or find for worst case channel
occupancy.
o
Max Hold
: Capture all activity in the band including the Max signal envelope mode with vector graphics
and real-time activity with vertical bars. Use this mode anytime you want to detect activity for a long
period of time. It is a very powerful mode to detect activity in busy bands such as 2.4 GHz. As this is a
cumulative mode,
while on Spectrum Analyzer screen you can clear the spectrum anytime with the
RETURN button.
o
Average
: Average is calculated over the last sweep Iterations. This is the best possible choice to remove
unwanted noise, particularly useful in constant wave (CW) and channel signals display.
o
Normal
: No calculation is done, just raw data as a result of the real-time sweep.
o
Overwrite
: Useful to track unlimited activity in the band. Darker areas will point to high activity signal.
You can clear the spectrum anytime with the RETURN button.
•
Iterations
: The number of sweep data iterations to perform calculations on. It goes from 1 to 16. As an example, a
value of 5 with Calculator: Average means the DSP will use 5 complete accumulated sweeps to average data.
Note
: Selecting a higher or lower Top dBm value is a very frequent workflow, as you typically want to zoom in or out based
on signal power being measured. RF Explorer Spectrum Analyzer main screen offers two keyboard shortcuts: [Up] and


