


XCell™ Lab Controller
User Guide
44 repligen.com XC-LAB-UG-V4
The Trend application lets you query tags (data points or logged variables) from the Wonderware
Historian database and plot them. When you start the Trend application for the first time, you are
immediately prompted to connect to a Historian server. If you are opening an existing Trend file that
includes at least one server configuration and the login was successful, you are not prompted to log
in. It comes with 4 preconfigured trend files for your convenience.
In order to simplify the setup, Repligen has pre-configured several options and configurations for
you. For example, the tags are pre-loaded, and the screen layout has been optimized for viewing.
Trend supports two different chart types: a regular trend curve and an XY scatter plot. Multiple plot
configuration and display options are available (
), and it is easy to save preferred layouts
for future use.
For more information on using
tag picker
and
time picker
7.12.3
Query Tool
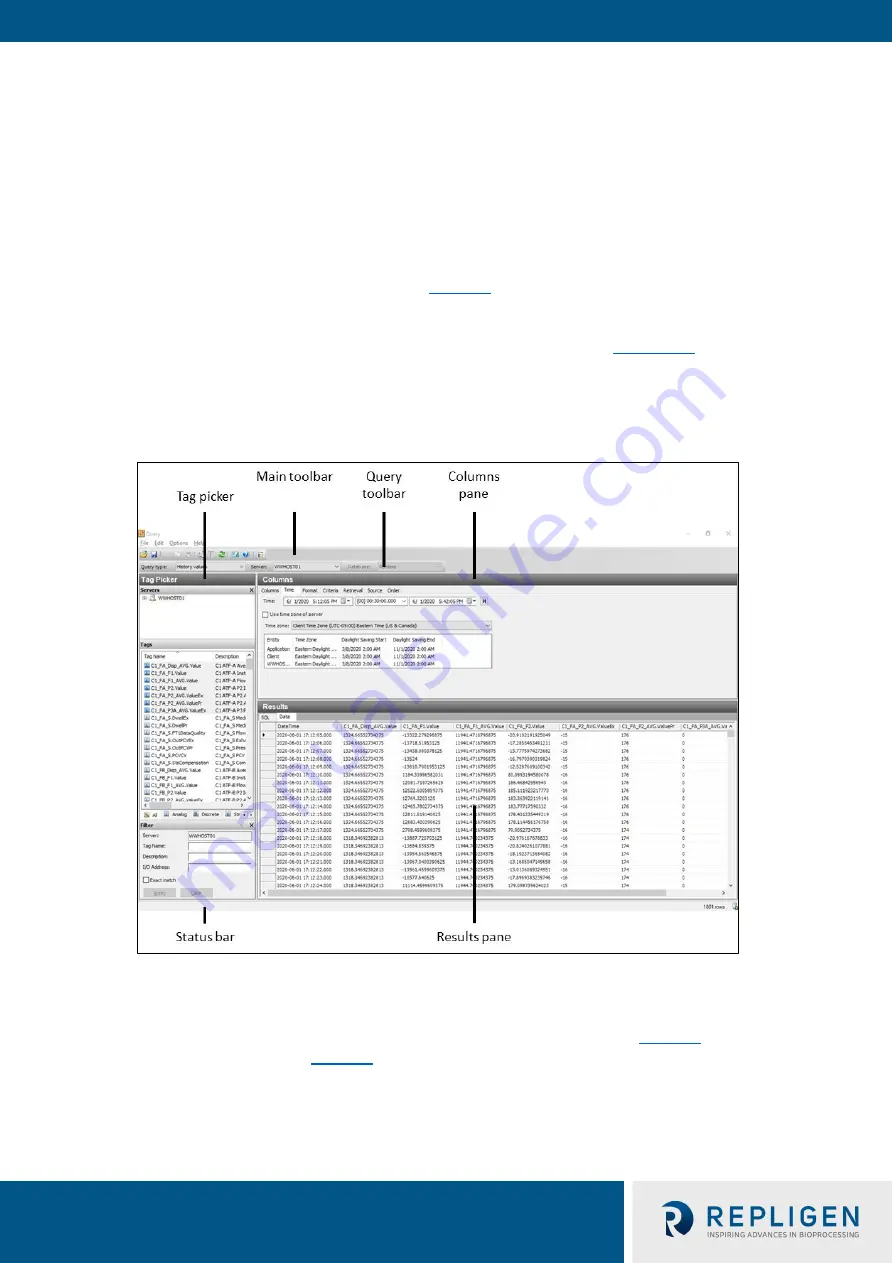
Figure 39. Query example
7.12.4
Exporting data to Excel
To export data:
1.
Select
History Values
from the
Query type:
drop-down menu (top left,
2.
In the
Columns Pane
), go to the
Format
tab, select the
Wide query format
.
3.
In the
Columns Pane
, go to the
Retrieval
tab, select
Cyclic
from the retrieval mode drop-
down. For
Cyclic attributes,
select
Values spaced every
select
1 second
(as shown below).


