background image

R0E530640MCU00 User’s Manual 

5. Debugging Functions 

REJ10J1733-0100  Rev.1.00  Apr. 01, 2008 
Page 144 of 229 


(1) Setting measurement conditions 


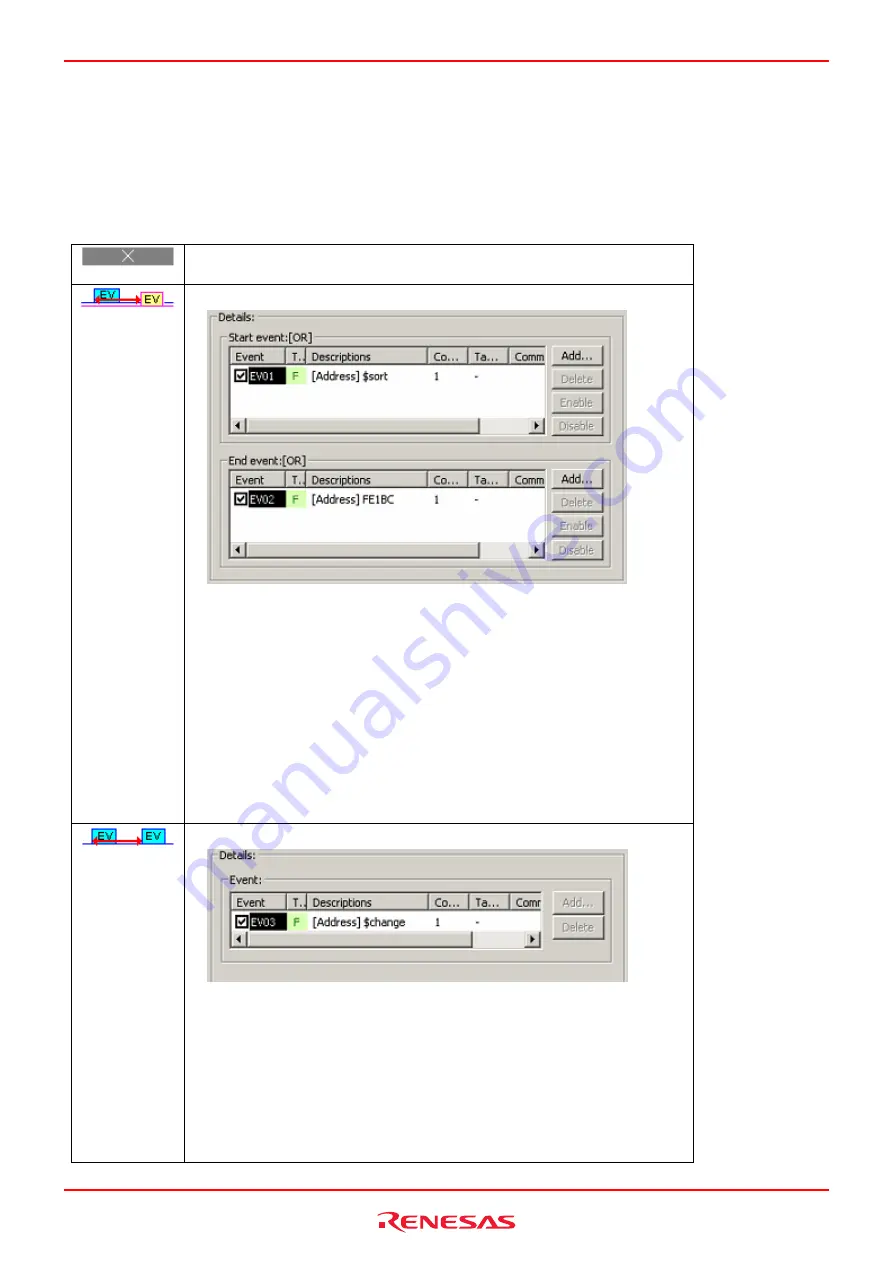
A measurement condition can be selected from the following four modes. Select one measurement condition for one section. 
Use events to set a section. Event counts are fixed to 1. Even when an event count is set to other than 1, it is handled as 1. 
 
Table 5.24 Measurement condition modes 

  [Disabled]


Not measured. 

  [Between two events] 


Figure 5.68 Between two events 
 
Measurement is taken of time from when a start event occurs to when an end 
event occurs. 
Specifically, measurement is taken of an execution time and execution count 
in the range set by a start event and an end event. The measurement of time 
starts when a start event occurs and is aborted when an end event occurs. 
The execution count is incremented by one each time a start event and an 
end event occur in pairs within the set range. 
 
Start event: One or multiple events can be set. 
End event: One or multiple events can be set. 


  [Event cycle counting] 


Figure 5.69 Event cycle counting 
 
Measurement is taken of periods in which an event occurs. 
Namely, measurement is taken of an event occurrence period and execution 
count. The time from when an event occurs to when the next event occurs is 
measured as one instance of measurement. The execution count is 
incremented by one each time an event occurs. 
 
Event: Only one event point can be set. 


Содержание M16C/64

Страница 1: ...REJ10J1733 0100 T R0E530640MCU00 Rev 1 00 Apr 01 2008 User s Manual E100 Emulator MCU Unit for M16C 64 Group...

Страница 2: ...such as safety systems or equipment or systems for transportation and traffic healthcare combustion control aerospace and aeronautics nuclear power or undersea communication transmission If you are co...

Страница 3: ...is any question or doubt about this product contact your local distributor The related manuals for using this product are listed below You can download the latest manuals from the Renesas Tools homepa...

Страница 4: ...r program development and evaluation stages In mass producing your program you have finished developing be sure to make a judgment on your own risk that it can be put to practical use by performing in...

Страница 5: ...nstantly making efforts to improve the design and performance of this emulator Therefore the specification or design of this emulator or its user s manual may be changed without prior notice About the...

Страница 6: ...s an imminently dangerous situation that will cause death or heavy wound unless it is avoided However there are no instances of such danger for the product presented in this user s manual WARNING WARN...

Страница 7: ...this cable is 125 volts When you connect to a power supply of more than 125V use an appropriate cable for the voltage z If you smell a strange odor hear an unusual sound or see smoke coming from this...

Страница 8: ...pins of the emulator main unit and the target MCU connector pins directly Static electricity may damage the internal circuits z Do not pull this emulator by the communications interface cable or the...

Страница 9: ...tem 28 2 6 2 Turning ON OFF the Power 28 2 7 Self check 29 2 8 Selecting Clock Supply 30 2 8 1 Clocks 30 2 8 2 Using an Internal Oscillator Circuit Board 31 2 8 3 Using the Oscillator Circuit on the U...

Страница 10: ...r 75 4 6 1 Disconnecting the Emulator 75 4 7 Quitting the High performance Embedded Workshop 75 4 8 Setting Up the Debug 76 4 8 1 Specifying a Download Module 76 4 8 2 Setting Up Automatic Execution o...

Страница 11: ...quisition 132 5 9 8 Showing Trace Results 133 5 9 9 Filtering Trace Information 135 5 9 10 Searching for Trace Records 137 5 9 11 Saving Trace Information to Files 138 5 9 12 Loading Trace Information...

Страница 12: ...Realtime Profile Information 186 5 13 2 Setting Realtime Profile Measurement Modes 188 5 13 3 Measuring Function Profiles 188 5 13 4 Setting Function Profile Measurement Ranges 189 5 13 5 Saving Funct...

Страница 13: ...ences between the Actual MCU and Emulator 217 7 3 Connection Diagram 218 7 3 1 Connection Diagram for the R0E530640MCU00 218 7 4 External Dimensions 219 7 4 1 External Dimensions of the E100 Emulator...

Страница 14: ...tion created when installing the software in the following folder Your registered information is used for only after sale services and not for any other purposes Without user registration you will not...

Страница 15: ...face Furthermore it permits a range of operations from editing a project to building and debugging it to be performed within the same application In addition it supports version management Emulator de...

Страница 16: ...R8C E100 emulator debugger User s Manual 1 Please keep the R0E530640MCU00 s packing box and cushion material in your place for reuse at a later time when sending your product for repair or other purpo...

Страница 17: ...e This is an interface cable for the host machine and emulator 5 AC adapter supply for the emulator 6 Host machine A personal computer to control the emulator 7 Pitch converter board for connecting th...

Страница 18: ...ternal trigger connector 5 System status LEDs 6 Target status LEDs Figure 1 2 Names of each part of the emulator 1 Power switch This is a switch to turn ON OFF the emulator 2 USB cable connector This...

Страница 19: ...check is being executed SAFE OFF Emulator system is not operating normally system status error 6 Target Status LEDs The target status LEDs indicate operating status of the target MCU and power supply...

Страница 20: ...s transition 255 pass counts Exception event detection Violation of access protection task stack access violation OS dispatch initialization omitted Real time trace 192bits 4M cycles Address data stat...

Страница 21: ...s OS Windows XP 1 Windows 2000 CPU Pentium IV 1 6 GHz or more recommended Interface USB 2 0 2 Memory 768 MB or greater more than 10 times the file size of the load module recommended Pointing device s...

Страница 22: ...wer supply to the power connector 7 Turn on the power supply Turn ON the power to the emulator 8 Check the LED display of the emulator Check that the system status LED is lighting When the user system...

Страница 23: ...d POWER and RESET of the target status LED are lighting When the user system is not connected the POWER LED does not light up 18 Start up the emulator debugger from the High performance Embedded Works...

Страница 24: ...a user with administrator rights Note that users without administrator rights cannot complete the installation When you insert the included CD ROM to a CD ROM drive a message will appear Install the s...

Страница 25: ...nit R0E530640MCU00 Insert the MCU unit following the inside rails of the main unit 100 HIGH PERFORMANCE EMULAT OR SYST EM R0E530650MCU00 Push the MCU unit down to check it is attached properly Disconn...

Страница 26: ...2008 Page 26 of 229 2 4 Connecting the Host Machine USB interface is used for connecting the emulator to the host machine The USB cable is connected to the USB cable connector of the emulator and the...

Страница 27: ...cable to the outlet Figure 2 5 Connecting the emulator power supply CAUTION Cautions for AC Adapter z Use only the AC adapter included in the E100 package z The included AC adapter is exclusively for...

Страница 28: ...he power again after shutting OFF the power wait for about 10 seconds IMPORTANT Notes on Power Supply z The emulator pin Vcc is connected to the user system in order to monitor user system voltage For...

Страница 29: ...er system 2 Turn on the emulator 3 Launch the emulator debugger and select the Start booting up on successful completion of self checking check box in the Device Setting dialog box 4 When you click OK...

Страница 30: ...the MCU Clock Display of emulator debugger Description Default setting Emulator IC17 mounting oscillator module Yes User Oscillator circuit on the user system Main XIN XOUT Generate Internal generator...

Страница 31: ...rom the E100 emulator main unit and replace the oscillator module of the IC17 see Figure 2 7 CN 1 40a 1a CN 2 40a 1a CN 3 40a 1a 40b 1b CN 4 40a 1a 40b 1b 40b 1b CN6 1 50 51 100 CN5 1 50 51 100 40b 1b...

Страница 32: ...circuit in the E100 can generate any arbitrary frequency specified by the emulator debugger and it can be supplied as a main clock It does not depend on either the oscillator circuit board in the MCU...

Страница 33: ...s product to your user system 100 pin Flexible cable 0 65mm pitch 0 5mm pitch R0E0100TNPFK00 100 pin LQFP R0E0100TNPFJ00 100 pin QFP Figure 2 10 Connecting this product to the user system CAUTION Note...

Страница 34: ...the CN2 side of the flexible cable 5 Attach the CN1 side of the R0E0100TNPFJ00 to the CN1 side of the flexible cable 5 1 100 pin 0 65mm pitch PRQP0100JD B foot pattern No 1 pin User system FLASH versi...

Страница 35: ...to the CN2 side of the flexible cable 5 Attach the CN1 side of the R0E0100TNPFK00 to the CN1 side of the flexible cable 5 1 100 pin 0 5mm pitch PLQP0100KB A foot pattern No 1 pin User system FLASH ve...

Страница 36: ...ly The tutorial function generates the random data to be sorted and calls the sort and the change functions in that order The sort function accepts as its input an array that contains the random data...

Страница 37: ...r the directory specify the one that is given below OS installed drive Workspace Tutorial E100 M16C For the file specify the one that is shown below Figure 3 1 Open Workspace dialog box 3 3 Connecting...

Страница 38: ...the object program you want to debug Note however that the program to be downloaded and the address in the microcomputer to which downloaded differ with each microcomputer used Read the display of str...

Страница 39: ...ce level Double click Tutorial c of C source file Figure 3 3 Editor window displaying the source program If necessary you can change the font and font size to make text more easily readable For detail...

Страница 40: ...are breakpoints easily For example you can set a software breakpoint at a place where the sort function is called Double click a row in the S W Breakpoints column corresponding to the source line that...

Страница 41: ...CPU from the Debug menu or click the Reset CPU button in the toolbar 3 6 2 Executing the Program To execute the program choose Go from the Debug menu or click the Go button in the toolbar The program...

Страница 42: ...e 3 6 Status window CAUTION The contents displayed in this window differ with each product For details about the displayed contents of each product refer to Chapter 3 Debugging or online help 3 7 Chec...

Страница 43: ...nu or click the Registers toolbar button The Register window shown below will be displayed Figure 3 8 Register window The content of any register can be altered Double click the line for the register...

Страница 44: ...mbols The Labels window permits you to display the symbol information included in a module Choose Symbols Labels from the View menu or click the Labels toolbar button The Labels window shown below wil...

Страница 45: ...ed For example you can check the content of memory corresponding to _main in byte size as shown below Choose CPU Memory from the View menu or click the Memory toolbar button to display the Display Add...

Страница 46: ...ginning of a program Click the left hand side of the array a displayed in the Editor window and place the cursor there Select Instant Watch with the right mouse button The dialog box shown below will...

Страница 47: ...iable or Expression edit box and click the OK button An int type variable i will be displayed in the Watch window Figure 3 16 Watch window showing a variable Clicking the mark shown to the left of the...

Страница 48: ...indow Click the mark shown to the left of the class instance p_sam in the Locals window to display the elements comprising the class instance p_sam Look at the elements of the class instance p_sam bef...

Страница 49: ...and steps in a called function and stops at the first statement of the called function To enter the sort function choose Step In from the Debug menu or click the Step In button in the toolbar Figure 3...

Страница 50: ...ction by executing it quickly and stops at the next statement of a program from which the function was called To exit the sort function choose Step Out from the Debug menu or click the Step Out button...

Страница 51: ...nction call as one step and then stops at the next statement of the main program To execute all statements in the change function at a time choose Step Over from the Debug menu or click the Step Over...

Страница 52: ...hop permits you to forcibly break a program Clear all breakpoints To execute the rest of the tutorial function choose Go from the Debug menu or click the Go button in the toolbar Figure 3 25 Go button...

Страница 53: ...ied Address The Editor window permits you to set an instruction fetch event easily For example you can set an instruction fetch event at a place where the sort function is called Double click a row in...

Страница 54: ...of the Hardware Break dialog box In the Editor window select a global variable that you want to be the object of a hardware break so that a program is made to stop when it reads or writes a value to t...

Страница 55: ...e memory that can hold an execution record of up to 4M bus cycles which is always updated during program execution The content of trace memory is displayed in the Trace window Choose Code Trace from t...

Страница 56: ...ively from when the user program starts running till when it breaks 1 Clear all break conditions Click the right mouse button anywhere in the Trace window and choose Acquisition from the context menu...

Страница 57: ...g menu Processing will be halted by a break and the trace information from start to break will be displayed in the Trace window Figure 3 31 Trace window free trace 4 A mixed display of bus disassemble...

Страница 58: ...33 0100 Rev 1 00 Apr 01 2008 Page 58 of 229 5 Furthermore choosing Display Mode SRC from the context menu you can display trace information in a bus disassemble and source mixed mode Figure 3 33 Trace...

Страница 59: ...point is encountered This facility allows you to keep track of program flow from trace information without having to break the user program 1 If any break conditions are set clear all of them 2 Choose...

Страница 60: ...ion in the Editor window and drag and drop it into the OR page Click the Apply button and then the Close button Thus the debugger will start acquiring trace information from when the main function is...

Страница 61: ...ox will be displayed Switch the trace mode to Fill until stop and click the Apply button Then click the Close button 2 Set a software break in a line of the tutorial function where p_sam s0 a 0 is wri...

Страница 62: ...layed in the upper pane of the Trace window Figure 3 38 Trace window function execution history after analysis 6 Double click any function in the displayed function execution history and the trace inf...

Страница 63: ...e Therefore the necessary information can be extracted easily 1 Clear all break conditions Click the right mouse button anywhere in the Trace window and choose Acquisition from the context menu that i...

Страница 64: ...enu Figure 3 41 Trace window Auto Filter 6 That way the trace information for only R in the R W column can be displayed Figure 3 42 Trace window Auto Filter Notes 1 The filter function does not affect...

Страница 65: ...nformation it is possible to show which function is the caller to the function where the current PC exists Set a software breakpoint in any line of the sort function by double clicking at its correspo...

Страница 66: ...re breakpoint that you have set in a line of the sort function by double clicking at its corresponding row in the S W Breakpoints column again 3 19 What Next In this tutorial we have introduced to you...

Страница 67: ...Programs on the Start menu choose Renesas High performance Embedded Workshop High performance Embedded Workshop The Welcome dialog box shown below will appear Figure 4 1 Welcome dialog box Select a s...

Страница 68: ...below to create a new workspace 1 In the Welcome dialog box select the radio button titled Create a new project workspace and click the OK button Figure 4 2 Welcome dialog box 2 Project Generator will...

Страница 69: ...igure 4 4 Setting the Target System for Debugging dialog box Select the target platform you use by placing a check mark in its check box and click the Next button 4 Set a configuration name Configurat...

Страница 70: ...he OK button in it starts the High performance Embedded Workshop 5 After starting the High performance Embedded Workshop connect the E100 Emulator 4 3 Creating a New Workspace Toolchain Used Follow th...

Страница 71: ...nsuing list CPU family Select the CPU family of the MCU you are using Toolchain To use a toolchain select the appropriate toolchain here If you do not use select None The other list boxes are used for...

Страница 72: ...t platforms click the Next button and then set a configuration name for each target platform selected When you have finished setting configuration names emulator related settings are completed Click t...

Страница 73: ...ear Figure 4 11 Open Workspace dialog box Specify the directory in which workspaces are created select a workspace file extension hws and click the Select button 3 The High performance Embedded Worksh...

Страница 74: ...register download modules and the command chain to be automatically executed When you are finished filling in the Debug Settings dialog box the emulator will be connected 2 Loading a session file Swi...

Страница 75: ...res described below 1 Choose Disconnect from the Debug menu 2 Click the Disconnect tool button 3 Enter the disconnect command in the Command Line window 4 7 Quitting the High performance Embedded Work...

Страница 76: ...the Debug menu to open the Debug Settings dialog box Figure 4 12 Debug Settings dialog box In the Target drop down list box select the product name you want to connect In the Default debug format drop...

Страница 77: ...re 4 13 Debug Settings dialog box Here register a command chain that is automatically executed with specified timing Select your desired timing from the following four choices When the emulator is con...

Страница 78: ...ces after retarded for delay cycles from when trace point is reached Repeat fill until stop Collects a total of 512 cycles before and after trace point Trace mode Repeat fill until full Collects a tot...

Страница 79: ...mulator Device setting from the Setup menu after starting the emulator In this case however be aware that changes of the settings after starting the emulator are not reflected immediately and will be...

Страница 80: ...arget MCU you have set here cannot be changed after the emulator is connected To change the target MCU you need to disconnect the emulator and connect it again 2 Selecting an operation mode Select one...

Страница 81: ...d PM10 b0 of 0x000005 as set to 1 To enable or disable the program ROM 2 area specify the PRG2C0 zeroth bit of program 2 area control register setting When using the user program with PRG2C0 set to 1...

Страница 82: ...lock can be selected from three choices Emulator User and Generate By default Emulator is selected Select Emulator when the main clock is supplied from an internal source or User when the main clock i...

Страница 83: ...cannot be used at the same time Select one function from them Initially code coverage is selected The setting of this option can be changed even after startup When the code coverage function is select...

Страница 84: ...es dialog box Memory map page The MCU group box displays the device selected in the Device setting dialog box You cannot change it on this page The Memory map page does not appear when single chip mod...

Страница 85: ...operties dialog box set up the overwriting of flash ROM blocks block by block Figure 5 4 Configuration properties dialog box Internal flash memory overwrite page Block by block settings matched to the...

Страница 86: ...lloon Figure 5 5 Configuration properties dialog box Exception Warning page The initial settings of Violation of access protection and Read from uninitialized memory are effective When downloading the...

Страница 87: ...howing the history of processing The history display area on the left hand side of the dialog box shows the history of completed processing The contents shown here are recorded in a trouble report To...

Страница 88: ...s with progress bars The upper progress bar shows the progress of the entire boot up processing The lower progress bar shows the progress of each individual processing The content of the currently exe...

Страница 89: ...indow and then choose Download from the pop up or context menu CAUTION Before a program can be downloaded you must have it registered as a load module in the High performance Embedded Workshop For det...

Страница 90: ...ist Hardware breakpoint is set Trace point fetch condition is set A hardware breakpoint can be inserted by double clicking in the event column Trace points are displayed when fetch conditions are set...

Страница 91: ...or Column States dialog box 3 Deselect the check box of the column you want to turn off Click the OK button and the new column settings you have set will take effect 5 2 4 Turning columns in one sourc...

Страница 92: ...used to display disassembled codes Click the Disassembly toolbar button Choose Disassembly from the View menu Use the Ctrl D accelerator In this case the Disassembly window opens at the current PC pos...

Страница 93: ...xt menu and a dialog box labeled Assemble will be displayed Use this dialog box to correct assembly language Figure 5 11 Assembler dialog box The dialog box shows the address instruction code and mnem...

Страница 94: ...address of the internal RAM is allocated as a RAM monitor area 2 Monitor display The access statuses are displayed in different background colors depending on access attributes as listed below The ba...

Страница 95: ...n choose Show Error Detection from the context menu Uninspected memory is displayed in sky blue 5 3 2 Setting RAM Monitor Update Intervals Choose Update Interval Setting from the context menu of the R...

Страница 96: ...rom the View menu or click the View Status toolbar button This window does not update the displayed status during program execution Figure 5 13 Status window The Status window has the following four s...

Страница 97: ...entry label BreakCondition Break factors of the user program ExecutionTime Result of time measurement Exception Status of the exception event 1 When more than one break factors occur When you click o...

Страница 98: ...Extended Monitor window The extended monitor function only monitors the signals output from the user system or MCU and does not affect execution of the user program To open the Extended Monitor window...

Страница 99: ...the Items to Be Displayed Choose Properties from the context menu of the Extended Monitor window and the Extended Monitor Configuration dialog box will be displayed Figure 5 18 Extended Monitor Config...

Страница 100: ...et as a software breakpoint is reached a message Software Break is displayed on the Debug sheet of the Output window with the program made to stop there At this time the Editor or the Disassembly wind...

Страница 101: ...2 In the S W Breakpoints column double click the line where you want the program to stop Figure 5 19 Editor window Or you use the method described below to set a breakpoint Select Toggle Breakpoint fr...

Страница 102: ...the Editor or the Disassembly window From the Breakpoints dialog box From the command line 1 From the Editor or the Disassembly window 1 Place the cursor at the line where a software breakpoint exist...

Страница 103: ...2008 Page 103 of 229 2 From the Breakpoints dialog box 1 Select Source Breakpoints from the Edit menu to bring up the Breakpoints dialog box In this dialog box you can alternately enable or disable a...

Страница 104: ...ccessed under a specified condition Interrupt Detection is made of an interrupt generation and interrupt termination Trigger input An event is detected when the signal fed in from external trigger sig...

Страница 105: ...click Figure 5 24 Hardware Break dialog box 2 The Event dialog box shown below will be displayed In this dialog box set detail event conditions and then click the OK button Figure 5 25 Event dialog bo...

Страница 106: ...from the Registered Events dialog box 1 Click the Add button in the Registered Events dialog box Figure 5 27 Registered Events dialog box 2 The Event dialog box shown below will be displayed In this d...

Страница 107: ...ts dialog box 2 Adding an event from the event column of the Editor window When adding a hardware breakpoint 1 Select the HW Break Point from the popup menu displayed by double clicking or right click...

Страница 108: ...igure 5 31 Hardware Break dialog box When adding a trace point 1 Select the Trace Point from the popup menu displayed by double clicking or right clicking anywhere in the event column of the Editor wi...

Страница 109: ...istered as an event Static variables in functions cannot be registered as an event 2 Dragging and dropping a function name into the Event column you can set an event based on an instruction fetch to t...

Страница 110: ...k the Delete button You can use the keys Ctrl Del instead of clicking the Delete button The selected event will be removed from the event setting area Figure 5 33 Hardware Break dialog box 2 To remove...

Страница 111: ...log box To remove one point select a line you want to remove in the Registered Events dialog box and then click the Delete button You can use the keys Ctrl Del instead of clicking the Delete button Th...

Страница 112: ...following methods to register an event Up to 256 events can be registered 1 Registering events When creating an event from the Event dialog box 1 Display the Comments page of the Event dialog box and...

Страница 113: ...into the list Figure 5 38 Hardware Break dialog box and Registered Events dialog box When registering an event from the Registered Events dialog box Click the Add button to create an event The events...

Страница 114: ...out ever being registered After the event is used i e changed or removed its setting becomes nonexistent The events you create by only double clicking in the Event column of the Editor window are the...

Страница 115: ...n The content of what you have set has no effect until you click the Apply button after the title on the title bar of the dialog boxes of Hardware break Trace conditions or Performance Analysis Condit...

Страница 116: ...t conditions 5 8 2 Setting Hardware Breakpoints 1 Setting Hardware Breakpoints For hardware breakpoints you can set an OR condition other condition AND Accumulation AND Simultaneous subroutine sequent...

Страница 117: ...the Editor window while the OR condition is disabled the OR condition is automatically enabled If you reenable the OR condition when it is disabled the previously set event is restored with its OR con...

Страница 118: ...conditions Type Description 1 AND Accumulation Breakpoint is encountered when all of the set events occur irrespective of the time axis 2 AND Simultaneous Breakpoint is encountered when all of the set...

Страница 119: ...les Initial value 0 5 8 3 Saving Loading the Set Contents of Hardware Breaks 1 Saving hardware break settings Click the Save button of the Hardware Break dialog box The Save dialog box will be display...

Страница 120: ...ption break forced halt or breakpoint the contents stored in trace memory at the time the program has stopped are displayed as the trace result even when no trace points are encountered yet 5 9 2 Acqu...

Страница 121: ...ytes requested from the CPU DB Data access in bytes requested from the CPU IW Instruction code read in words requested from the CPU DW Data access in words requested from the CPU R W Shows the data bu...

Страница 122: ...The unnecessary columns in the Trace window can be hidden To hide a column right click in the header column and select the column you want to hide from the context menu 5 9 3 Setting Trace Informatio...

Страница 123: ...formation specified by events or delete the unnecessary portions 4 Recording step execution If the selected trace mode is Fill until stop you can record step execution To record step execution select...

Страница 124: ...imum value of trace capacity 4 Repeat fill until stop Each time a trace point is encountered acquisition is made for a total of 512 cycles before and after that point and acquisition continues that wa...

Страница 125: ...g Possible 3 Fill around TP Trace acquisition is halted a specified number of cycles delayed after a trace point is encountered In this mode the user program continues running and only trace acquisiti...

Страница 126: ...le CAUTION If trace points are encountered in consecutive cycles in the repeat fill until stop or repeat fill until full mode only one first cycle is highlighted in yellow as a trace point 5 9 5 Setti...

Страница 127: ...OR condition when it is disabled the previously set event is restored with its OR condition check box selected However if a maximum of 16 points is exceeded when you have reenabled for an event the e...

Страница 128: ...onditions dialog box Table 5 21 Other conditions Type Description 1 AND Accumulation Trace point is encountered when all of the set events occur irrespective of the time axis 2 AND Simultaneous Trace...

Страница 129: ...Read from uninitialized memory Stack access violation Performance overflow Realtime profile overflow Task stack access violation OS dispatch 5 Specifying a delay value The program breaks a specified...

Страница 130: ...are extracted Duration of an event occurring in a subroutine Only cycles where a specified event occurred in a specified address range subroutine or function are extracted Extraction Instruction acce...

Страница 131: ...CAUTION When you specify extraction or deletion conditions you cannot select DIS disassemble display and SRC source display from Display Modes in the Trace window When you use a data access event for...

Страница 132: ...y Use the Options page of the Trace conditions dialog box to make this selection Figure 5 56 Trace conditions dialog box Select which signal you want to be acquired from three choices available Event...

Страница 133: ...odes on the context menu of the Trace window There are five trace result display modes Bus Display Disassembled Display Source Display and Mixed Display 1 Bus Display Mode In the context menu select D...

Страница 134: ...trace cycle Figure 5 59 Source Display screen 4 Mixed Display Mode This display mode provides a mixed display of bus disassemble or source display After choosing Display Modes BUS from the context me...

Страница 135: ...Fill around TP and the selected display mode is Bus or Disassembled 1 Auto filter function To use the filter function choose Auto Filter from the context menu of the Trace window When Auto Filter is...

Страница 136: ...bugging Functions REJ10J1733 0100 Rev 1 00 Apr 01 2008 Page 136 of 229 If there are multiple items you can specify in the Option dialog box these items can be used as an OR condition with which to fil...

Страница 137: ...ed more than one condition in the combination column set items for each condition The items you have set are searched for as multiple AND conditions The conditions you have set are shown in the Find S...

Страница 138: ...tent setting column can be used as OR conditions for a search performed Up to 16 conditions 16 lines can be set CAUTION The conditions set on one and the same line in the search content setting column...

Страница 139: ...rted with the trace display updated Use this function when you only want to stop acquiring trace information and check the trace information without stopping program execution 5 9 14 Restarting Trace...

Страница 140: ...on History from the context menu or click the Analyze Execution History button in the toolbar the emulator starts analyzing the execution history from the end of the trace result and shows the result...

Страница 141: ...ed Initially this window is blank When you choose Analyze Execution History from the context menu that is displayed when you right click in the upper pane or click the Analyze Execution History button...

Страница 142: ...ce measurement conditions cannot be manipulated during program execution 5 10 2 Showing the Result of Performance Measurement Measurement results are displayed in the Performance Analysis window To op...

Страница 143: ...on time It shows a cumulative time of measured execution time Count Shows the number of times measured Statistic Shows a ratio of cumulative execution time relative to Go Break execution time Ratio ca...

Страница 144: ...taken of an execution time and execution count in the range set by a start event and an end event The measurement of time starts when a start event occurs and is aborted when an end event occurs The e...

Страница 145: ...of a function use Between two events Set a fetch to the beginning address of the function as a start event and a fetch to the exit of the function where return statement is written as an end event If...

Страница 146: ...0 7 About the Maximum Measurement Time of Performance 1 Maximum measurement time The timer used for performance measurement is comprised of a 40 bit counter The maximum measurement time varies with th...

Страница 147: ...upon a break The E100 emulator supports C0 Instruction coverage rate and C1 Branch coverage rate Table 5 27 Code coverage definition C0 Instruction coverage rate All statements within code are execute...

Страница 148: ...rce file The respective sheets permit multiple ranges to be registered Up to two instances of the Code Coverage window can be opened at the same time 5 11 3 Allocating Code Coverage Memory Hardware Re...

Страница 149: ...specify any of 1 8 blocks maximum 2 Mbytes each beginning with the 256 Kbyte boundary and any of 1 8 blocks maximum 1 Mbyte each beginning with the 128 Kbyte boundary as a code coverage measurement ar...

Страница 150: ...es before being changed is retrieved from coverage memory into a coverage only buffer Figure 5 75 Schematic of coverage memory allocation change The data accumulated in a coverage only buffer is retai...

Страница 151: ...ed However data is not updated for the areas that have no coverage memory allocated The areas whose data are not updated are displayed in gray An example display is shown below Figure 5 76 Code Covera...

Страница 152: ...ssembler source The acquired coverage information is accumulated in memory until the user clears it When you double click Assembler code shown in the Address Range sheet the corresponding source code...

Страница 153: ...r 01 2008 Page 153 of 229 2 In the Add Address Range dialog box that is displayed enter an address range Figure 5 78 Add Address Range dialog box 3 The address range you have added will be displayed i...

Страница 154: ...ange address ranges 1 From the Address Range sheet of the Code Coverage window 1 Select an address range you want to change in the Address Range sheet and while holding it selected choose Edit Range f...

Страница 155: ...Code Coverage window Figure 5 82 Code Coverage window 5 11 7 Removing Address Ranges Follow the procedure described below to remove address ranges 1 From the Address Range sheet of the Code Coverage...

Страница 156: ...sking for your confirmation will be displayed Choose to save or not save coverage data To save specify a file name and then click the OK button If you do not save simply click the OK button Figure 5 8...

Страница 157: ...However data is not updated for portions that have no coverage memory allocated The address lines whose data are not updated are displayed in gray An example display is shown below Figure 5 86 Code Co...

Страница 158: ...ranched F Condition not met and program not branched T F Condition met and condition not met Address Instruction address Assembler Disassembled display Source C C or assembler source The acquired cove...

Страница 159: ...ed in the upper area of the Code Coverage window Figure 5 89 Code Coverage window 5 11 10 Removing Source Files Delete source files by the following methods 1 From the Source sheet of the Code Coverag...

Страница 160: ...for your confirmation will be displayed Choose to save or not save coverage data To save specify a file name and then click the OK button If you do not save simply click the OK button Figure 5 91 Del...

Страница 161: ...ight click in the upper area of the Code Coverage window and choose Percentage from the context menu The emulator will start calculating the C0 instruction coverage rate and C1 Branch coverage rate fo...

Страница 162: ...func2 10 file1 cpp func3 80 file1 cpp func4 70 file2 cpp func1 20 file2 cpp func2 60 file2 cpp func3 90 file3 cpp func1 0 file3 cpp func2 30 file3 cpp func3 10 2 Clicking the C0 Coverage column The da...

Страница 163: ...p func1 0 5 11 13 Searching for Unexecuted Lines Search a selected address range or function for unexecuted lines When you click the Find button in the toolbar the Find dialog box shown below is displ...

Страница 164: ...coverage information Choose Clear the Entire Coverage from the context menu and all code coverage information will be cleared 5 11 15 Updating Coverage Information Update the content of the Code Cover...

Страница 165: ...hown below will be displayed Figure 5 96 Save Coverage Data dialog box Enter a file name in which you want the information to be saved If a file extension is omitted the extension cov is automatically...

Страница 166: ...can be loaded If you enter any other file extension an error message is output The files you added are listed in the Load Coverage Data dialog box The files are loaded in the order in which they are...

Страница 167: ...box To begin with select the check box labeled Clear coverage RAM before loading 2 Add a coverage file for test A in merge mode 3 Add a coverage file for test B in merge mode 4 Add a coverage file for...

Страница 168: ...w is displayed in source mode coverage results are displayed in its code coverage column The positions corresponding to the source lines that have had instructions executed are highlighted in yellow I...

Страница 169: ...ate what kinds of accesses have been made to the data area This function collects access information every byte without causing a program to break Therefore the realtime capability of the user program...

Страница 170: ...time 5 12 3 Allocating Data Coverage Memory Hardware Resource 1 Memory allocation Before data coverage can be measured data coverage memory must be allocated to the addresses at which to be measured...

Страница 171: ...acquired from the addresses before being changed is retrieved from coverage memory into a coverage only buffer Figure 5 106 Schematic of data coverage memory allocation change The data accumulated in...

Страница 172: ...overage is measured Access Rate Shows access rates by a percentage and graph The lower area shows detail information of the address range selected in the upper area Table 5 36 Contents in the lower ar...

Страница 173: ...described below to add address ranges 1 From the Address Range sheet of the Data Coverage window 1 Right click in the upper area of the Address Range sheet and choose Add Range from the context menu F...

Страница 174: ...Data Coverage window Figure 5 110 Data Coverage window 5 12 6 Changing Address Ranges Follow the procedure described below to change address ranges 1 From the Address Range sheet of the Data Coverage...

Страница 175: ...2008 Page 175 of 229 2 In the Edit Address Range dialog box that is displayed change the address range Figure 5 112 Edit Address Range dialog box 3 The address range you have changed will be displaye...

Страница 176: ...e Data Coverage window 1 Select an address range you want to remove in the Address Range sheet and while holding it selected choose Delete Range from the context menu Figure 5 114 Data Coverage window...

Страница 177: ...R0E530640MCU00 User s Manual 5 Debugging Functions REJ10J1733 0100 Rev 1 00 Apr 01 2008 Page 177 of 229 3 The address range you have selected will be removed Figure 5 116 Data Coverage window...

Страница 178: ...which coverage is measured Access Rate Shows access rates by a percentage and graph The lower area shows detail information of the address range selected in the upper area Table 5 38 Contents in the...

Страница 179: ...procedure described below to add sections 1 From the Section sheet of the Data Coverage window 1 Right click in the upper area of the Section sheet and choose Add Range from the context menu Figure 5...

Страница 180: ...upper area of the Data Coverage window Figure 5 120 Data Coverage window 5 12 10 Removing Sections Follow the procedure described below to remove sections 1 From the Section sheet of the Data Coverage...

Страница 181: ...pting for your confirmation will be displayed Choose to save or not save coverage data To save click the Yes button and specify a file name If you do not save click the No button Figure 5 122 Confirma...

Страница 182: ...ification The Data Coverage window is vertically divided into halves by a splitter The upper area shows the automatically registered task stacks and access rates Table 5 39 Contents in the upper area...

Страница 183: ...5 Clear Coverage Range dialog box Specify the start and end address of the range you want to clear Click the OK button and the specified range will be cleared 2 Clearing all data coverage information...

Страница 184: ...own below will be displayed Figure 5 126 Save Data dialog box Enter a file name in which you want the information to be saved If a file extension is omitted the extension cdv is automatically attached...

Страница 185: ...Use this dialog box to enter a coverage information file you want to load You can specify a load mode and offset for each file you load Only the files bearing the extension cdv can be loaded If you e...

Страница 186: ...cumulative execution time execution rate and average execution time of functions The function profile of the E100 emulator does not include the execution time of subroutines in its cumulative display...

Страница 187: ...the measurable range Even after the program returned to a high order function execution counts of the function from which program execution started cannot be measured f Function measurement To measure...

Страница 188: ...urement results are cleared 5 13 3 Measuring Function Profiles Measure execution performance one function at a time Figure 5 130 Realtime Profile window function profile The following shows detail inf...

Страница 189: ...an be measured profile memory must be allocated to the addresses at which to be measured Profile data can be obtained from only the address range that has had memory allocated The emulator permits any...

Страница 190: ...ify an existing file name a message is displayed asking you to confirm whether you want the file to be overwritten 5 13 6 Loading Function Profile Measurement Ranges Load a function profile measuremen...

Страница 191: ...etails on each column Block Block number Task ID Task ID entry address Count Number of times a task is called Time Cumulative time of task execution The time stamp is displayed in the form shown below...

Страница 192: ...Task mode Figure 5 134 Realtime Profile Setting dialog box 1 Automatic task detection If you have downloaded a load module that has the OS included in it the E100 emulator automatically detects a task...

Страница 193: ...rement tasks Click the Load button of the Realtime Profile Setting dialog box and the Open dialog box will be displayed Figure 5 135 Open dialog box Enter a file name you want to load Only the files b...

Страница 194: ...As dialog box will be displayed Enter a file name in which you want the measurement results to be saved If a file extension is omitted the extension txt is automatically attached If you specify an exi...

Страница 195: ...aximum measurement time No Resolution Maximum measurement time 1 10ns Approx 3 hours 03 minutes 15 seconds 2 20ns Approx 6 hours 06 minutes 30 seconds 3 40ns Approx 12 hours 13 minutes 00 seconds 4 80...

Страница 196: ...am some section exceeded the maximum measurement time or maximum measurement count Realtime profile overflow It is detected that during profile measurement some function or task exceeded the maximum m...

Страница 197: ...e access protected In that case reduce the amount of used blocks by removing blocks before setting protection again Access attribute Read Write Write access Read Only Detected Read access Write Only D...

Страница 198: ...elow to set an access protected area 1 From the Hardware Break dialog box 1 Select the Exception check box on the Hardware Break sheet and then click the Detail button Figure 5 138 Hardware Break dial...

Страница 199: ...ram is downloaded select the check box labeled Automatically set address areas at downloading Figure 5 140 Violation of access protection dialog box 4 Click the Update button and the access attributes...

Страница 200: ...ctions REJ10J1733 0100 Rev 1 00 Apr 01 2008 Page 200 of 229 6 The protected area you have added will be displayed in the Address Areas list of the Violation of access protection dialog box Figure 5 14...

Страница 201: ...the Trace Mode drop down list of the Trace sheet select Fill around TP Select the Exception check box and then click the Detail button Figure 5 143 Trace conditions dialog box 2 The Exception page sh...

Страница 202: ...mitted is detected by the RAM monitor function Allocate a RAM monitor area to a given address range and enable error detection in that area Detection circuit Both histories of read access and write ac...

Страница 203: ...of a performance overflow as a condition of a hardware breakpoint Set the detection of a performance overflow as a condition of a trace point 5 14 6 Detecting a Realtime Profile Overflow This is a fu...

Страница 204: ...is enabled when a load module that includes the OS is downloaded It detects that a write to the relevant task stack was attempted from another task 1 Initial settings at startup At startup the check b...

Страница 205: ...below to set a task stack area 1 From the Hardware Break dialog box 1 Select the Exception check box on the Hardware Break sheet and then click the Detail button Figure 5 146 Hardware Break dialog bo...

Страница 206: ...as at downloading Figure 5 148 Violation of task stack access dialog box 4 Click the Update button and the task stack ranges will be automatically set 5 To add a task stack range manually click the Ad...

Страница 207: ...0100 Rev 1 00 Apr 01 2008 Page 207 of 229 2 From the Trace conditions dialog box 1 In the Trace Mode drop down list of the Trace sheet select Fill around TP Select the Exception check box and then cli...

Страница 208: ...Break dialog box 5 14 10 Detecting an OS dispatch This function becomes valid when a load module including an OS is downloaded It detects that task dispatch occurred 1 Actions taken when an OS dispat...

Страница 209: ...er halting the user program execution When The specified routine is executed immediately before execution of the user s program check box is selected the routine specified in the Starting address comb...

Страница 210: ...they were when the user program last stopped or the MCU registers that were set in the register window by the user The register contents changed after a specified routine is executed are not reflected...

Страница 211: ...ulator Power Supply Device setting dialog box of emulator debugger 1 Check the operating environment etc of the emulator debugger See 5 1 Setting Up the Emulation Environment 2 Reinstall the emulator...

Страница 212: ...tware and refer to the instruction described in it See Figure 6 2 Error occurred during the self check test dialog is displayed Click the OK button Check the log in the self check dialog Refer to inst...

Страница 213: ...the Host Machine page 26 SAFE LED does not light up Recheck the connection between the E100 and this product See 2 3 Connecting Disconnecting the MCU Unit to from the E100 Emulator Main Unit page 25...

Страница 214: ...page 67 Target MCU is in the reset state 1 Check the reset pin of the user system is pulled up 2 Check the reset pin of the user system has changed from L to H level Target MCU cannot be reset 1 If th...

Страница 215: ...then send the information to your local distributor http tool support renesas com eng toolnews registration support txt For prompt response please specify the following information 1 Operating environ...

Страница 216: ...Us for the R0E530640MCU00 Item Description Applicable MCU M16C 60 Series M16C 64 Group MCUs with 512 KB ROM or less Evaluation MCU R5F650MNFG EVA ROM size 8KB 16KB 512KB RAM size 31KB Applicable MCU m...

Страница 217: ...there is a pitch converter board etc between the evaluation ECU and user system Final evaluation of the voltage detect circuit voltage down detect interrupt voltage down detect reset etc should be exe...

Страница 218: ...connected to the user system The circuits not connected to the user system such as the emulator s control system are omitted Table 7 2 shows IC electric characteristics of this product for reference p...

Страница 219: ...EJ10J1733 0100 Rev 1 00 Apr 01 2008 Page 219 of 229 7 4 External Dimensions 7 4 1 External Dimensions of the E100 Emulator Figure 7 2 shows external dimensions of the E100 emulator W 73mm D 184mm H 13...

Страница 220: ...ard R0E0100TNPFJ00 Figure 7 3 shows external dimensions and a sample foot pattern of the converter board R0E0100TNPFJ00 for a 100 pin 0 65mm pitch QFP R0E0100TNPFJ00 REV B CN1 1 50 51 100 CN2 1 50 51...

Страница 221: ...ard R0E0100TNPFK00 Figure 7 4 shows external dimensions and a sample foot pattern of the converter board R0E0100TNPFK00 for a 100 pin 0 5mm pitch LQFP R0E0100TNPFK00 REV A CN1 1 50 51 100 CN2 1 50 51...

Страница 222: ...loading the firmware If this happens the product will not start up properly If the power is shut off unexpectedly redownload the firmware z Download the firmware with the user system not connected Not...

Страница 223: ...nt between an instruction setting PRC2 to 1 and a point where the port P9 direction register or the SI Oi control register is set 3 Setting PRC2 to 1 by the Memory window or Command Line window Note o...

Страница 224: ...internal ROM area z In CPU rewrite mode and erase suspend mode do not stop the program And do not single step an instruction shifting to CPU rewrite mode or erase suspend mode The emulator will be unc...

Страница 225: ...3 1 OFS 2 Access area of target MCU Bank 0 5 Bank 6 Bank 7 0 40000h 7FFFFh EXT 3 EXT MAP 4 1 1 40000h 7FFFFh EXT EXT MAP 40000h 7FFFFh EXT EXT MAP 0 80000h BFFFFh EXT EXT MAP 40000h 7FFFFh EXT EXT MAP...

Страница 226: ...is raised by any one of the following causes we will repair it or replace it with new one with extra charge Misuse abuse or use under extraordinary conditions Unauthorized repair remodeling maintenanc...

Страница 227: ...this product for repair to your local distributor Make sure that information in the Repair Request Sheet is written in as much detail as possible to facilitate repair CAUTION Note on Transporting the...

Страница 228: ...Publication Date Apr 01 2008 Rev 1 00 Published by Sales Strategic Planning Div Renesas Technology Corp Edited by Microcomputer Tool Development Department Renesas Solutions Corp 2008 Renesas Technolo...

Страница 229: ...R0E530640MCU00 User s Manual...

Отзывы: