OPERATION
43
To Display a Math Trace:
1.
From the Main Menu, select
Traces or press
F2
.
2.
From the
Traces
Sub-Menu, select
Math or press
F4
.
3.
Select the
Math
icon.
Note: If a math trace has already been set up once during your current
session, you will need to use the Edit
icon
to change the math trace.
4.
From the drop-down menus in the Edit Math Trace dialog box, select traces for
Trace A
and
Trace B
and select
OK
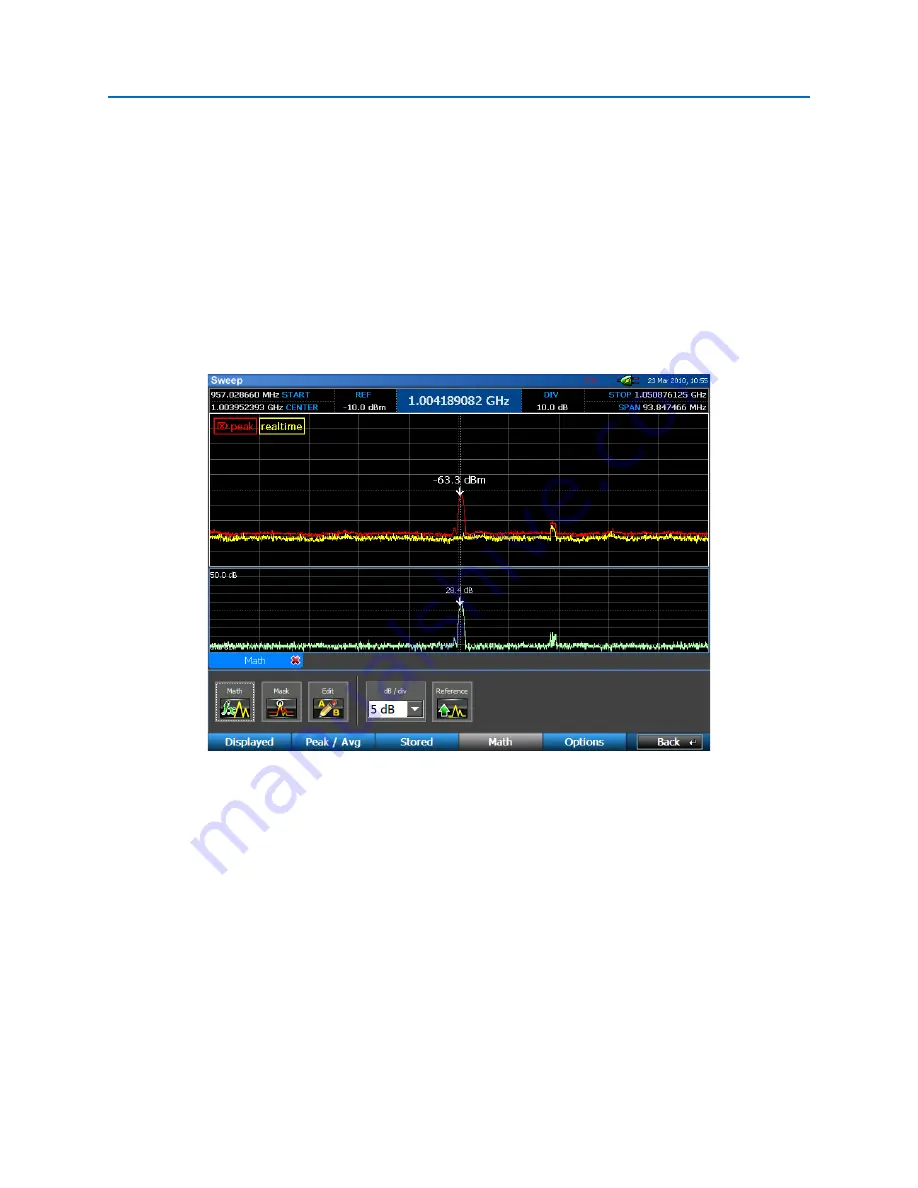
. The math trace will open in a tabbed window below the spectral display.
The example below shows a comparison between the peak trace and real time trace.
Several other tasks related to the math trace can be performed from the Traces|Math Sub-Menu.
•
Math
– Once a math trace has been set up, pressing the
Math
icon again will hide the math
trace. Each subsequent press of the
Math
icon will toggle the display of the math trace. Only
one math trace can be displayed at a time.
•
Mask – Compares the realtime trace to a stored mask trace and adds a signal to the signal list
when the difference exceeds a user defined threshold. This comparison is done on a sweep by
sweep basis. If the real time signal remains above the threshold then there is only one event
added to the list. If the realtime signal drops below the threshold and then exceeds the
threshold again, another event will be added to the signal list. The signal list table includes
frequency, power, bandwidth, timestamp, last seen timestamp and count information.
Содержание OSCOR Blue
Страница 2: ......
Страница 122: ...APPENDIX A15...


