


130
Chapter 15. Examining the Symbol Table
ptype
expr
ptype
Print a description of the type of expression
expr
.
ptype
differs from
whatis
by printing a
detailed description, instead of just the name of the type.
For example, for this variable declaration:
struct complex {double real; double imag;} v;
the two commands give this output:
(gdb) whatis v
type = struct complex
(gdb) ptype v
type = struct complex {
double real;
double imag;
}
As with
whatis
, using
ptype
without an argument refers to the type of
$
, the last value in the
value history.
info types
regexp
info types
Print a brief description of all types whose names match
regexp
(or all types in your program,
if you supply no argument). Each complete typename is matched as though it were a complete
line; thus,
i type value
gives information on all types in your program whose names include
the string
value
, but
i type ^value$
gives information only on types whose complete name
is
value
.
This command differs from
ptype
in two ways: first, like
whatis
, it does not print a detailed
description; second, it lists all source files where a type is defined.
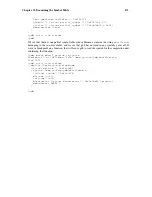
info scope
addr
List all the variables local to a particular scope. This command accepts a location--a function
name, a source line, or an address preceded by a
*
, and prints all the variables local to the scope
defined by that location. For example:
(gdb)
info scope command_line_handler
Scope for command_line_handler:
Symbol rl is an argument at stack/frame offset 8, length 4.
Symbol linebuffer is in static storage at address 0x150a18, length 4.
Symbol linelength is in static storage at address 0x150a1c, length 4.
Symbol p is a local variable in register $esi, length 4.
Symbol p1 is a local variable in register $ebx, length 4.
Symbol nline is a local variable in register $edx, length 4.
Symbol repeat is a local variable at frame offset -8, length 4.
This command is especially useful for determining what data to collect during a
trace experiment
,
see collect.
info source
Show information about the current source file--that is, the source file for the function containing
the current point of execution:
•
the name of the source file, and the directory containing it,
•
the directory it was compiled in,
•
its length, in lines,
Содержание ENTERPRISE LINUX 3 - SECURITY GUIDE
Страница 1: ...Red Hat Enterprise Linux 3 Debugging with gdb ...
Страница 12: ...2 Chapter 1 Debugging with gdb ...
Страница 28: ...18 Chapter 4 Getting In and Out of gdb ...
Страница 34: ...24 Chapter 5 gdb Commands ...
Страница 44: ...34 Chapter 6 Running Programs Under gdb ...
Страница 68: ...58 Chapter 8 Examining the Stack ...
Страница 98: ...88 Chapter 10 Examining Data ...
Страница 112: ...102 Chapter 12 Tracepoints ...
Страница 118: ...108 Chapter 13 Debugging Programs That Use Overlays ...
Страница 138: ...128 Chapter 14 Using gdb with Different Languages ...
Страница 144: ...134 Chapter 15 Examining the Symbol Table ...
Страница 170: ...160 Chapter 19 Debugging remote programs ...
Страница 198: ...188 Chapter 21 Controlling gdb ...
Страница 204: ...194 Chapter 22 Canned Sequences of Commands ...
Страница 206: ...196 Chapter 23 Command Interpreters ...
Страница 216: ...206 Chapter 25 Using gdb under gnu Emacs ...
Страница 296: ...286 Chapter 27 gdb Annotations ...
Страница 300: ...290 Chapter 28 Reporting Bugs in gdb ...
Страница 322: ...312 Chapter 30 Using History Interactively ...
Страница 362: ...352 Appendix D gdb Remote Serial Protocol ...
Страница 380: ...370 Appendix F GNU GENERAL PUBLIC LICENSE ...
Страница 386: ...376 Appendix G GNU Free Documentation License ...
Страница 410: ......


