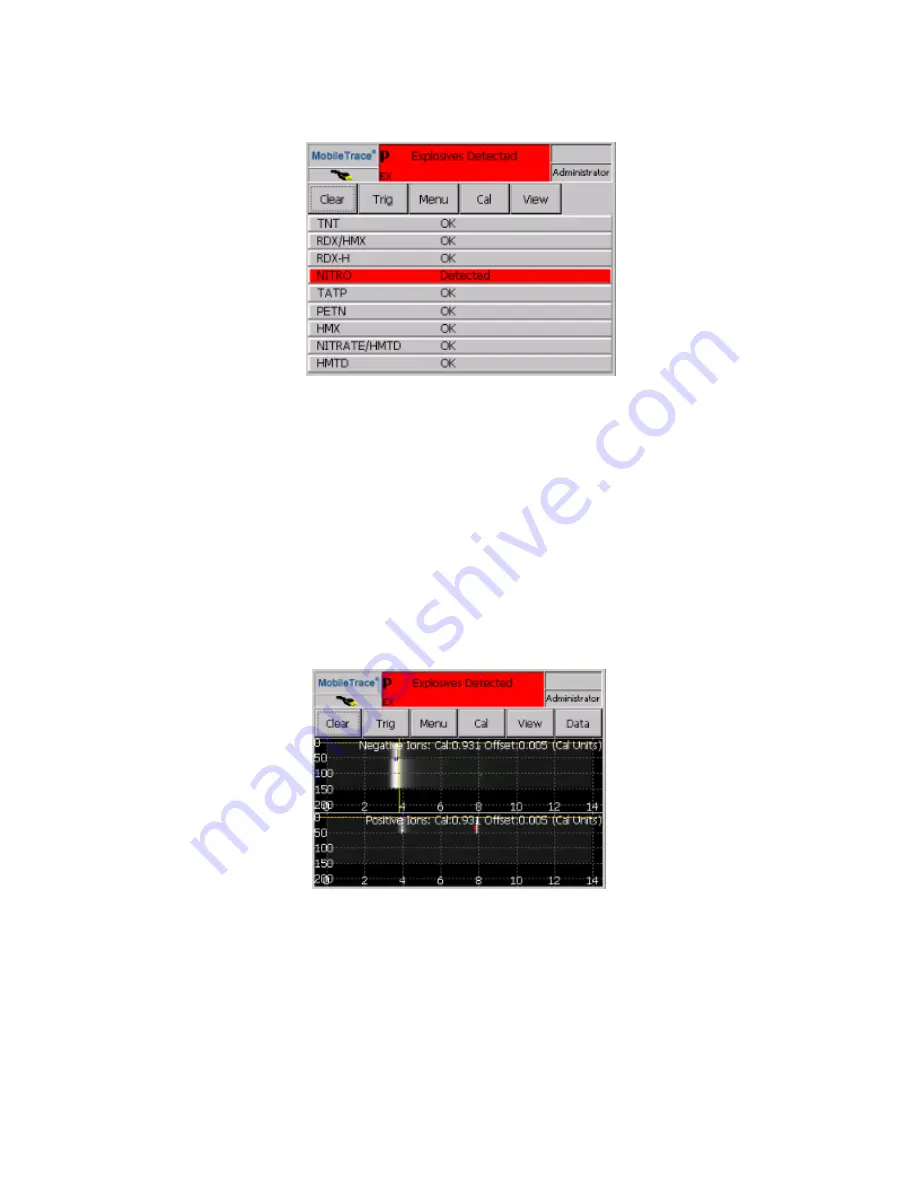
Figure 5-16
Select Scan view with substance names
Intensity Map View
The
Intensity Map view enables users to see, in one view, all plasmagrams that were collected during a sample.
The software stacks all plasmagrams on end, showing their height as intensity. Consequently, the wider white
areas on the
Intensity Map screen represent a sequence of peaks, and dark areas represent troughs. Vertical
lines represent a sequence of peaks that can be used to identify a substance. Details about the measurement
such as mean time, maximum and minimum height, and slope can be displayed by touching the line of the
detected desired peak.
To access the
Intensity Map view, select View/Intensity Map. To view the Intensity Map for the positive, negative,
or both modes, select Data/+/-ION, +ION, or -ION.
Figure 5-17
Intensity Map view
For information about how to navigate the plasmagram in the
Intensity Map view,
Plasmagram" on the previous page)
.
CHAPTER 5 │User's Guide
101
Rapiscan Systems Proprietary and Confidential
Содержание Mobile Trace
Страница 1: ...MobileTrace User s Guide For P0007027 MA001133 Revision ...
Страница 2: ......
Страница 31: ...This page intentionally left blank to ensure new chapters start on right odd number pages ...
Страница 60: ...CHAPTER 4 Menu Functions Main Screen 44 Menu Functions 45 ...
Страница 164: ...CHAPTER 9 Parts and Accessories Device and Replacement Part Numbers 148 ...
Страница 167: ...This page intentionally left blank to ensure new chapters start on right odd number pages ...
Страница 178: ...For P0007027 MA001133 Revision C ...


