1. OPERATION
1-43
1.29.5
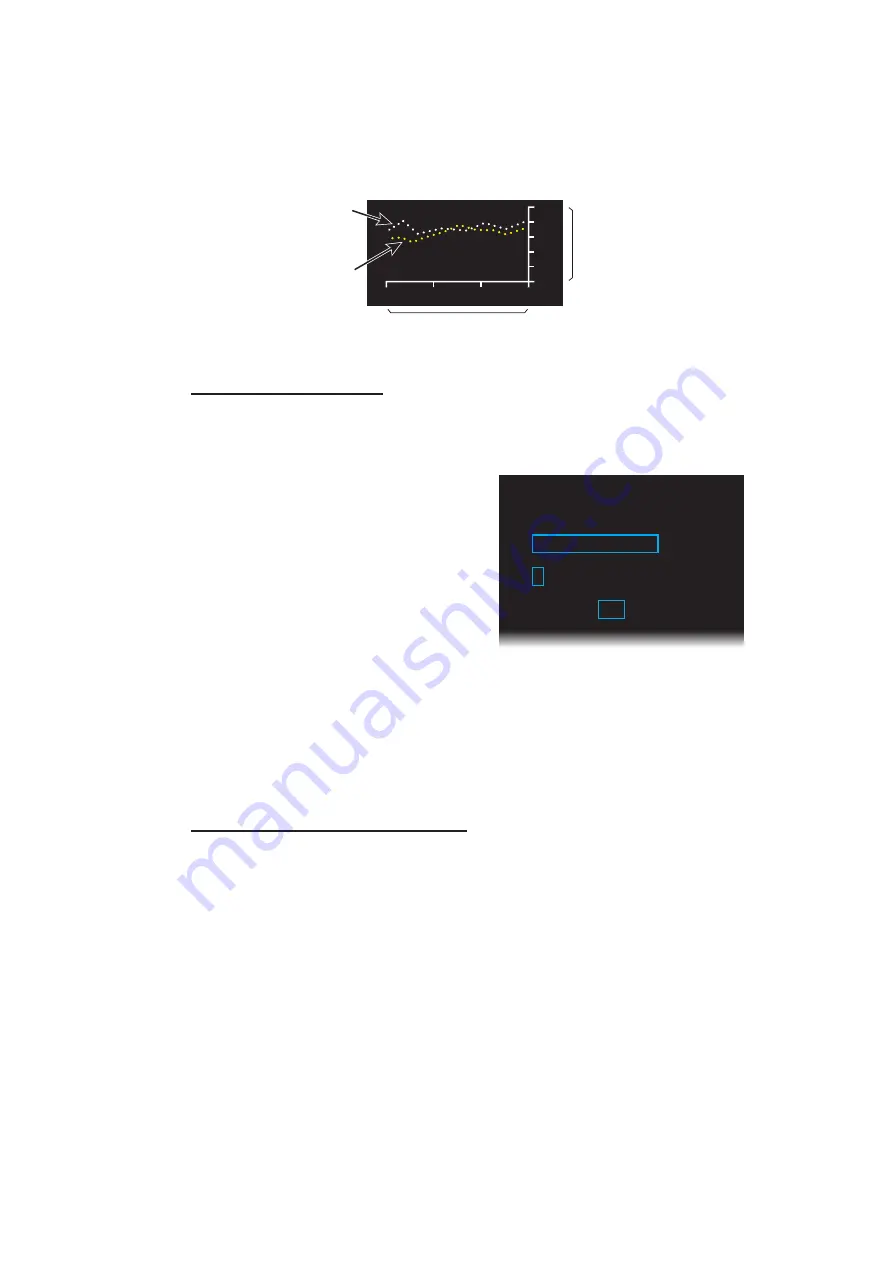
Depth graph
You can see the depth data in graph format by setting [GRAPH TYPE] to [GRAPHI-
CAL] (see step 3 in "Depth display format" on page 1-42). The depth graph shows the
depth history with dots, not a line.
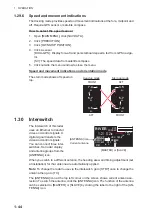
Depth graph example
How to set depth graph
1. Open [MAIN MENU], click [NAV DATA].
2. Click [DEPTH].
3. Click [DEPTH SCALE].
4. Click [SCALE TYPE].
5. Click the scale to use, [RADIO
ZEELAND] or [OTHERS].
6. Click an appropriate option for the
scale selected at step 5.
[RADIO ZEELAND]: 4, 10, 40
[OTHERS]: 10, 20, 50, 100, 200,
500
7. Click [BACK] to go back the [DEPTH] window.
8. Click [TIME SCALE].
9. Click the time scale (horizontal axis) for the depth graph, among 15 sec, 30 sec,
1 min and 3 min.
10. Click outside the menu window to close the menu.
How to select the depth sensor(s)
The depth graph can show depth data from the front and/or aft. The front data is shown
in white; aft data is yellow. See "Depth menu" on page 1-57 to select the depth sensor.
0
4
8
12
16
20m
3
2
1 min
Depth
Past time
Depth at front
sensor (white)
Depth at aft
sensor (yellow)
[DEPTH
SCALE]
1 BACK
2 SCALE
TYPE
RADIO
ZEELAND/OTHERS
3 RADIO
ZEELAND
4/10/40
4 OTHERS
10/20/50/100/200/500


