12
4
UC Surface Control Software
4.3 RTA
StudioLive™ Software
Library Reference Manual
The Quantum RTA provides several customization features that allow you
to view the RTA in the way that is most useful for your application.
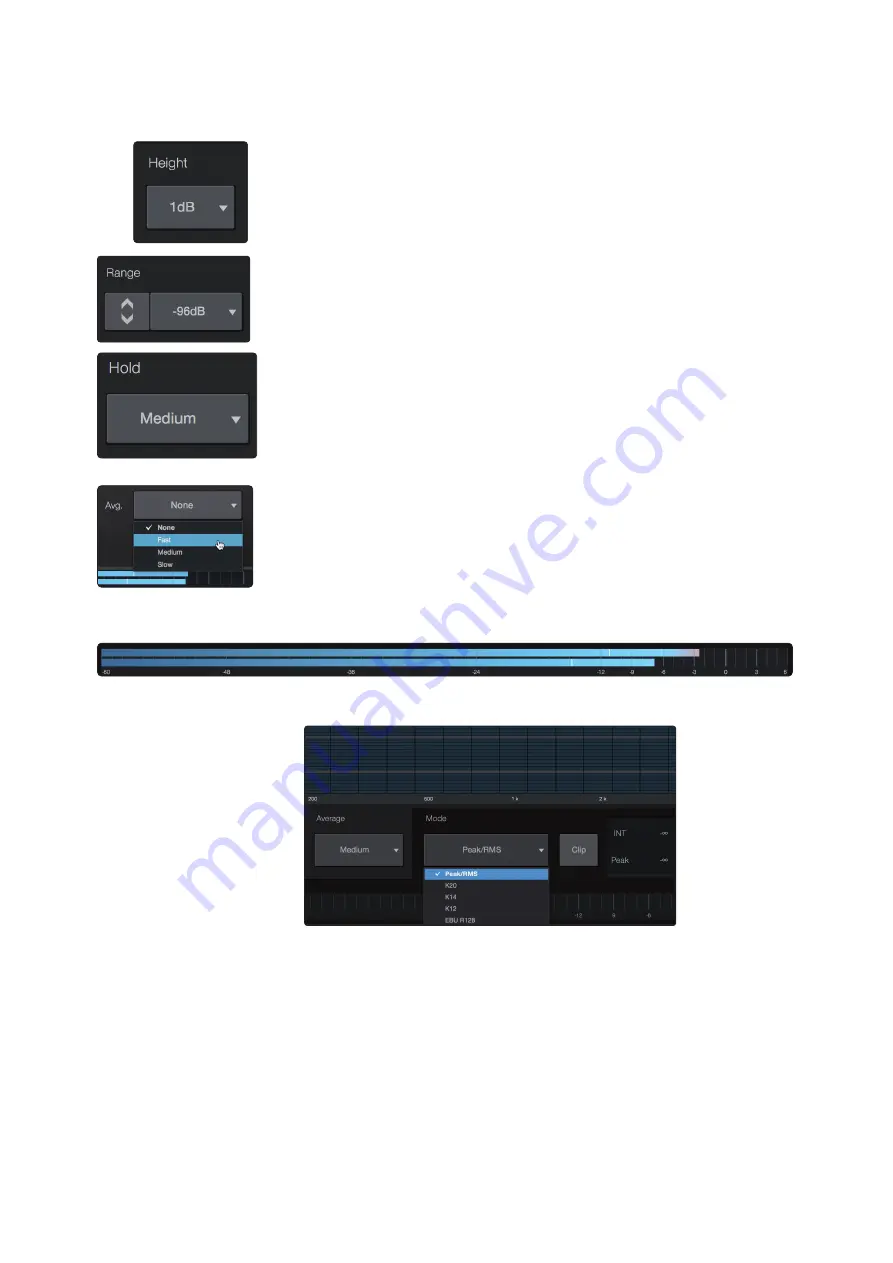
Height. This provides a more or less granular display for the RTA.
Range. Use the Range controls to set the upper and lower decibel limits that the RTA
will display.
Hold. Use this control to set the peak hold time for each band of the RTA.
Average. Averaging is a mathematical process that takes multiple data samples and
performs division to acquire a statistically more accurate calculation of the response.
That’s a technical way of saying that it slows down the “real-time” of a real-time
analyzer.
At the bottom of the screen, you will find the signal meter.
This meter can be customized for your application.
Meter Style. This menu allows you to change the type of output
metering displayed at the bottom of the screen.
•
Peak. This type of metering displays the instantaneous level of the audio signal.
•
K-20, K-14, and K-12. K-System metering displays loudness metering
and dynamic range. Select the scale based on the genre or media
format. K-20 is used for film, classical music, and high-fidelity recordings.
It provides the most dynamic range visualization. K-14 is used for
mainstream pop, rock, and country. K-12 is used for broadcast and
radio and provides the least dynamic range visualization.
•
EBU R128. Displays the perceived loudness of the
signal based on the EBU R128 standard.


