


9
SYSTEM TUNING
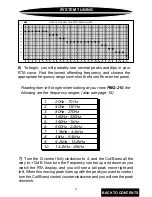
6) To begin, you will probably see several peaks and dips in your
RTA curve. Find the lowest offending frequency, and choose the
appropriate frequency range control on the face of the control panel.
25
31.5
40
50
63
80
100
125
160
200
250
315
400
500
630
800
1K 1.25K 1.6K
2K 2.5K 3.15K 4K
5K 6.3K 8K 10K 12.5K 16K 20K
THIRD OCTAVE REAL TIME SPECTRUM ANALYZER
PPI
12
09
06
03
00
03
06
09
12
RTA
7) Turn the Q control fully clockwise to 4, and the Cut/Boost all the
way to +12dB. Now turn the Frequency control up and down as you
watch the RTA display, and you will see a tall peak move right and
left. When this moving peak lines up with the peak you want to control,
turn the Cut/Boost control counterclockwise and you will see the peak
diminish.
Reading from left to right when looking at your new PMQ-210, the
following are the frequency ranges; (also see page 16)
1.
20Hz - 70 Hz
2.
40Hz - 130 Hz
3.
80Hz - 270Hz
4.
160Hz - 530Hz
5.
350Hz - 1kHz
6.
900Hz - 2.2kHz
7.
1.9kHz - 4.4kHz
8.
4kHz - 9.4kHz
9.
9.2kHz - 15.5kHz
10.
14.2kHz - 20kHz
BACK TO CONTENTS
Содержание PMQ-210
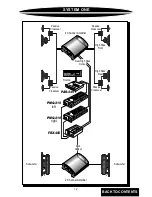
Страница 17: ...15 BLOCK DIAGRAM BACK TO CONTENTS ...
Страница 18: ...16 CONTROL PANEL BACK TO CONTENTS ...


