46 C a l c u l a t o r
•
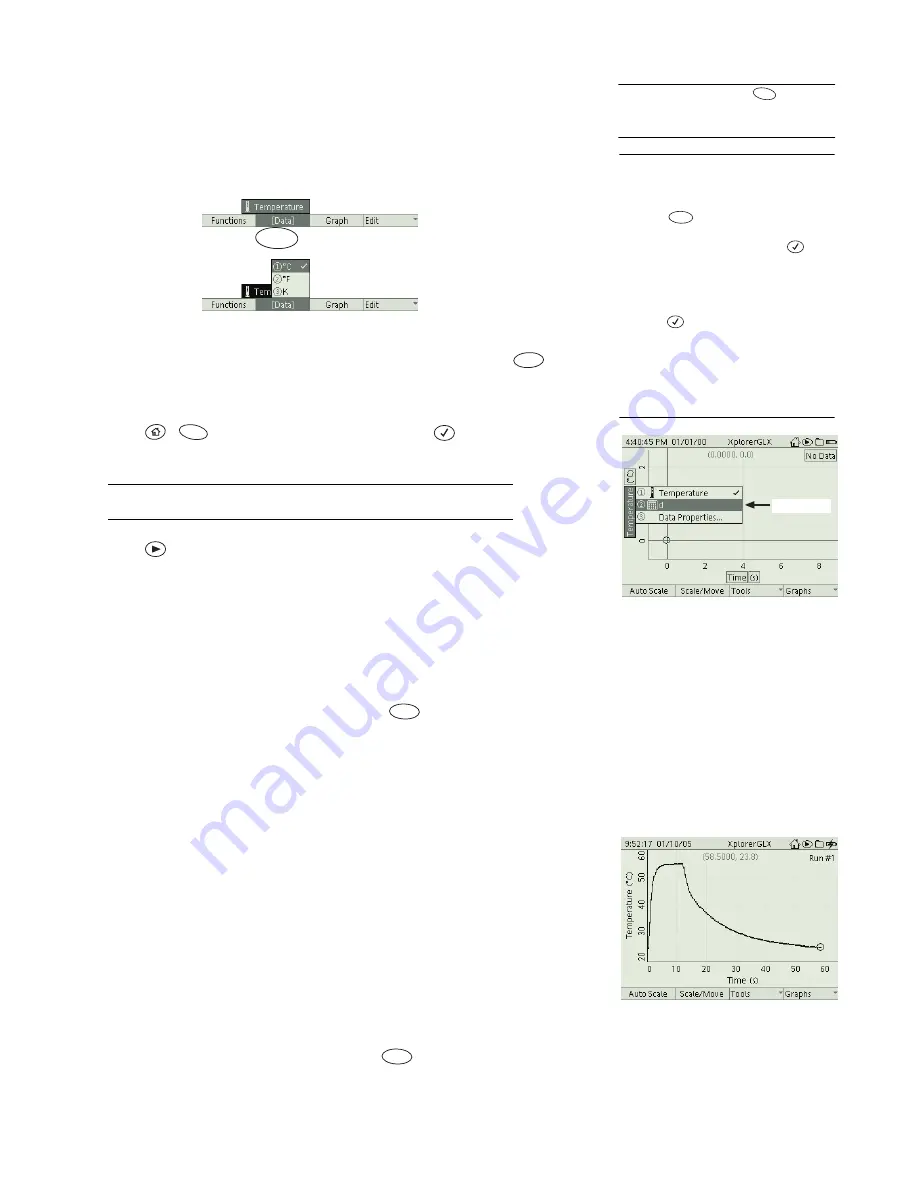
Open the calculator. On the first blank line, enter:
d = [Temperature (
°
C)] - 20
Instead of typing “[Temperature (°C)]”, select it from the [Data] menu.
10
Open the [Data] menu; select Temperature and °C
•
Press the up arrow key to place the cursor on the calculation. Press
to
view the calculation on the preview graph. Note how the calculated data dif-
fers from the original temperature data.
•
Press
+
to open the full-screen Graph. Press
twice to open the
vertical data source menu and choose the calculation (see right).
See “Data Source” on page 15 for more information about selecting data in
the Graph.
•
Press
to begin collecting data again. Note that the calculation is per-
formed in real time on the new data.
•
Calculations have no units by default. To assign units to a calculation, select
Data Properties from the data source menu in the Graph (see “Data Proper-
ties” on page 69).
•
In addition to sensor-collected data, calculations can operate on other data
sources, such as manually entered data sets, other calculations, and time. To
insert any data source into a calculation, press
and select it from the
[Data] menu.
Uses of Sensor-based Calculations
Shift Data Vertically
In the example above, the sensor-based calculation sub-
tracts 20 °C from the measured temperature. This calculation might be used in an
experiment where the difference between the measured temperature and room
temperature is of interest (a study of Newton’s law of cooling, for instance). The
calculation in the example shifts the temperature graph down by 20 °C.
Time-shift Data
When a data plot appears on the Graph with Time on the hori-
zontal axis, the plot can be shifted right or left with a time-based calculation.
For example, the graph shown at the right is from an experiment in which a tem-
perature probe was dipped into warm water, then removed, wiped dry, and
allowed to cool. The relevant data start after the probe was dried, about 14 sec-
onds from the start of data collection. To make the analysis simpler, the graph
needs to be shifted left so that the relevant data start at time zero. To do so, create
the calculation below. (To insert [Time (s)], press
and select it from the
[Data] menu.)
[Time (s)] - 14
9
For the
d
symbol, press
twice and
select it from the second Functions
menu.
F1
10
To select Temperature from the
[Data] menu
Keypad
1. Press
to open the [Data] menu.
2. Use the up or down arrow key to high-
light Temperature and press
;
or
press the number on the keypad cor-
responding to Temperature.
3. The units menu will open. Use the up
or down arrow key to highlight °C and
press ;
or
press the number on the
keypad corresponding to °C.
Mouse
1. Click [Data] to open the menu.
2. Click Temperature.
3. The units menu will open. Click °C.
F2
F2
F3
F1
Calculation
In the Graph, choose the calculation
from the data source menu
F2
This data plot needs to be time-
shifted
F2
Содержание Xplorer GLX
Страница 4: ......
Страница 6: ......
Страница 7: ...Part 1 Users Guide...
Страница 8: ......
Страница 18: ...12 O v e r v i e w o f t h e G L X...
Страница 94: ...88 S e t t i n g s S c r e e n...
Страница 98: ...92 P r i n t i n g...
Страница 104: ...98 O p e r a t i n g T e m p e r a t u r e...
Страница 112: ......
Страница 116: ...110 C a l o r i m e t r y...
Страница 132: ...126 V o l t a g e v e r s u s R e s i s t a n c e...
Страница 136: ...130 I n d u c e d E l e c t r o m o t i v e F o r c e...
Страница 146: ...140 B e a t F r e q u e n c y...
Страница 150: ......
Страница 152: ......


