


3.Functions and Operations
34
100 mV could also be specified as a Center of 25 mV with a Span of 150 mV.
Trend Chart
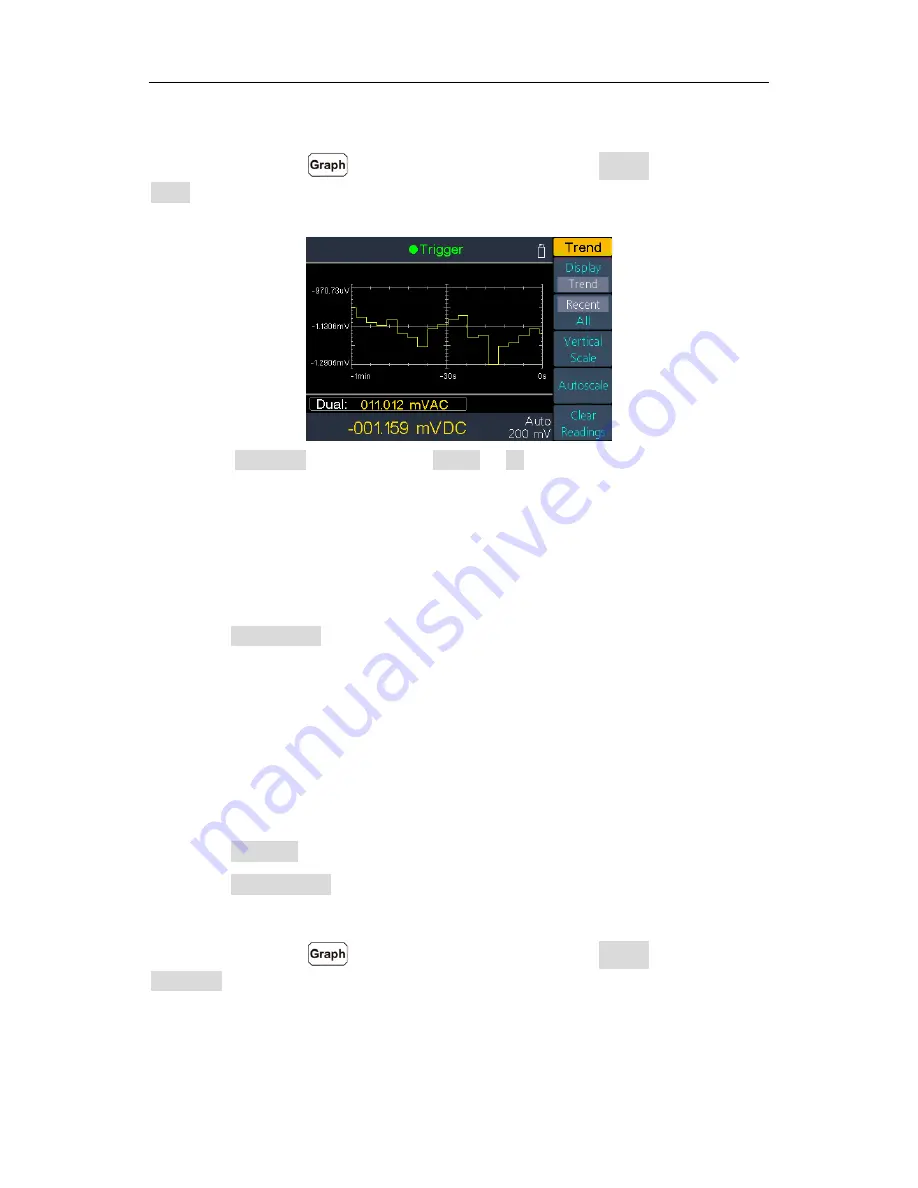
Press the front panel
key to access the menu, press the Display softkey to select
Trend. The trend chart shows data trends over time, users can directly observe the
variation of the measured data.
Press the Recent/All softkey to select Recent or All. In the trend chart,
Recent
shows
just the most recent data,
All
shows all of the data.
All
: The trend chart displays all readings being taken and builds from left to right. After
the display is filled, the data becomes compressed on the left side of the display as new
data is added on the right side of the display.
Recent
: The trend chart displays data taken during the last minute.
Press the Vertical Scale softkey to specifies how the current vertical scale is determined.
Default
: Set the scale to equal the measurement range. For example, for the DCV
measurement function, the vertical scale will be set as -200 mV to 200 mV when the
present range is 200 mV.
Manual
: Allow you to configure the scale either as
High
and
Low
values or as a
Span
around a
Center
value. For example, a scale that goes from a Low of -50 mV to a High
of 100 mV could also be specified as a Center of 25 mV with a Span of 150 mV.
Auto
: Automatically adjusts the scale to appropriately fit the line currently shown on
the screen.
Press the Autoscale softkey to automatically set the vertical scale once.
Press the Clear Readings softkey to clear reading memory and redraw.
Histogram
Press the front panel
key to access the menu, press the Display softkey to select
Histogram. In the histogram display, data is grouped in bins represented by vertical bars.
The histogram shows the distribution of measurement data.


