Version: 1.0, September 19, 2002
4 – APPLICATION INFORMATION
4.6 Typical
situations.
4.6.1 Introduction.
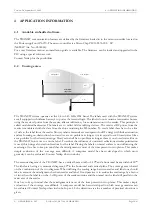
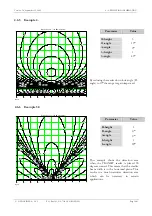
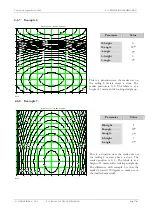
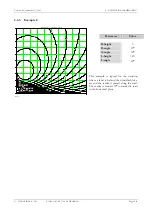
In the following diagrams a contour plot is shown of the received label signal. This contour plot gives always the
top view of the situation. The position of the reader is always at 0,0. The label is positioned in a area of 10 by 10
meter. The scale of the plot is such that every square has a dimension of 1 by 1 meter. The minimum signal
needed from the label is –100 dBm. This means that the area inside the –100 dBm contour represents the
detection area.
The following parameters are used within the examples:
Parameter
Description.
R-height
Mounting height of the TRANSIT reader with respect of the ground.
D-angle
Angle over which the reader is rotated in the vertical plane. When D-angle is
0 degrees the reader ‘looks’ parallel to the ground. When D-angle is 90
degrees the reader is ‘looking’ straight down.
A-angle
Angle over which the reader is rotated in the horizontal plane.
L-height
Mounting height of the transponder with respect to the ground.
L-angle
Angle over which the label is rotated in the vertical plane. When L-angle is 90
degrees the label is ‘looking’ parallel to the ground. When L-angle is 0 degrees
the label ‘looks’ straight up.
4.6.2 Example
1.
Rpow
5
4
3
2
1
0
1
2
3
4
5
0
1
2
3
4
5
6
7
8
9
10
50
60
70
80
80
90
90
90
90
100
100
100
100
100
100
110
110
110
110
120
120
130
130
140
140
Received power : -100 dBm minimum
Parameter
Value
R-height
1
D-angle
0
°
A-angle
0
°
L-height
1
L-angle
90
°
This example shows the ideal situation the
reader is positioned at the same height as the
label. This figure can be used for approaching
labels as for labels passing at certain distance
in front of the reader.
© NEDAP IDEAS – AVI
P.O. Box 103, NL-7140 AC GROENLO
Page 34-41

