


ANTENNA ORIENTATION
In order to get the best performance out of your ALTA Wireless Sensors, it is important to
note proper antenna orientation and sensor positioning. Antennas should all be oriented in
the same direction, pointing vertically from the sensor. If the sensor is mounted flat on its
back on a horizontal surface, you should bend the antenna as close to the sensor housing
as possible giving you the most amount of antenna pointing vertical. You should make the
antenna wire as straight as possible, avoiding any kinks and curving of the wire. Sensors
must be at least 3 ft. away from other sensors and the wireless gateway to function.
More Signal
Less Signal
PAGE 6
PAGE 7
VI. SENSOR OVERVIEW
Select
Sensors
from the main navigation menu on iMonnit to access the sensor overview
page and begin making adjustments to your H
2
S Sensors.
MENU SYSTEM
Details -
Displays a graph of recent sensor data.
History -
List of all past heartbeats and readings.
Actions -
List of all events attached to this sensor.
Settings -
Editable levels for your sensor.
Calibrate -
Reset readings for your sensor.
Scale -
Change the scale of readings for your sensor.
Details View
The Details View will be the first page you see upon selecting which sensor you would like
to modify.
Directly under the tab bar is an overview of your sensor. This allows you to see the signal
strength and the battery level of the selected sensor. A colored dot in the left corner of the
sensor icon denotes its status:
•
Green
indicates the sensor is checking in and within user defined safe parameters.
•
Red
indicates the sensor has met or exceeded a user defined threshold or
triggered event.
•
Gray
indicates that no sensor readings are being recorded, rendering the sensor
inactive.
•
Yellow
indicates that the sensor reading is out of date, due to perhaps a missed
heartbeat check-in.
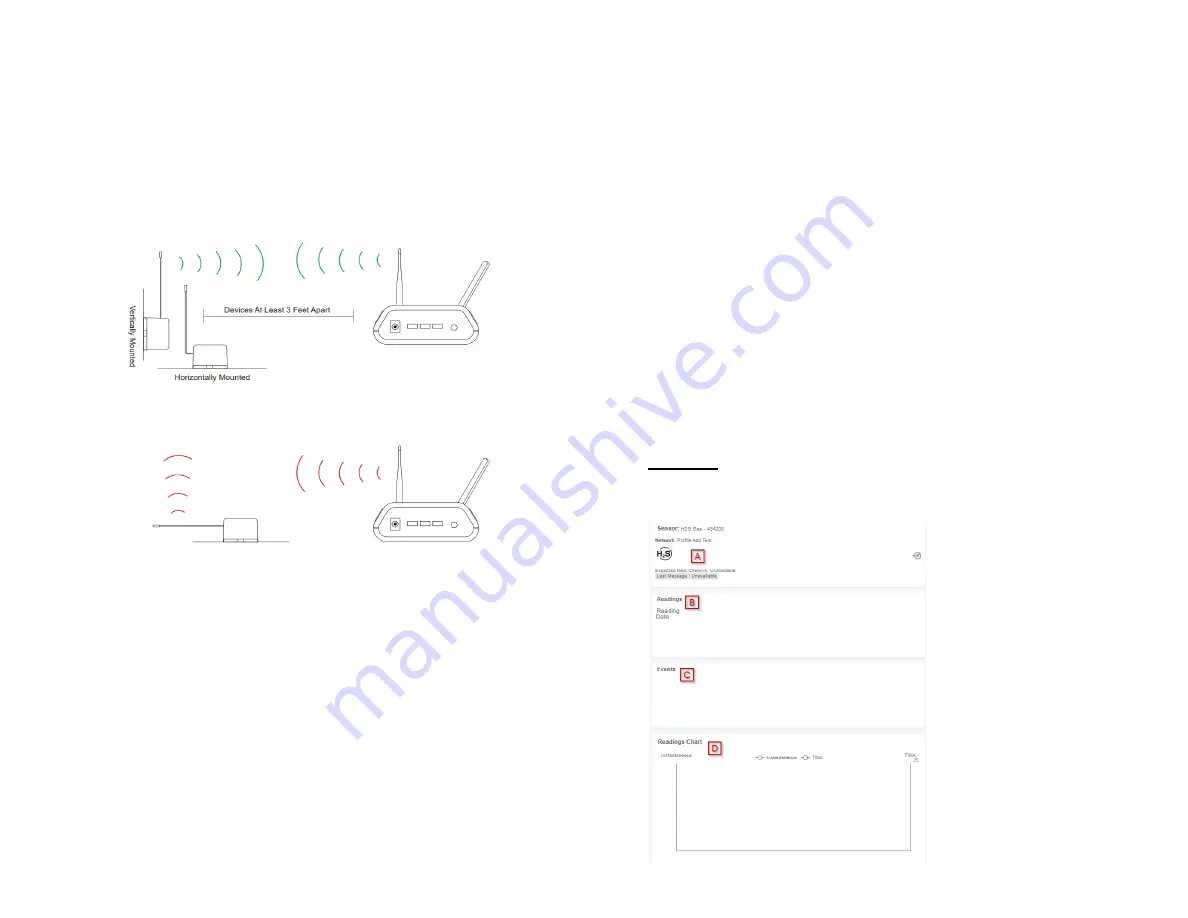
A.
The sensor overview section
will be above every page. This will
consistently display the present
reading, signal strength, battery level,
and status.
B.
The Recent Readings section
below the chart shows your most
recent data received by the sensor.
C.
The Actions section lists all actions
attached to the sensor.
D.
This graph charts how the sensor
fluctuates throughout a set date
range. To change the date range
displayed in the graph, navigate up to
the top of the Readings Chart section
on the right-hand corner to change
the from and/or to date.
Содержание ALTA H2S
Страница 1: ...by ALTA Wireless H2 S Sensor User Guide...


