12
E
n
g
li
sh
2.3 Configuring a unit
To configure a unit, click the button
(
figs. 6, 7) in the appropriate row of the
list.
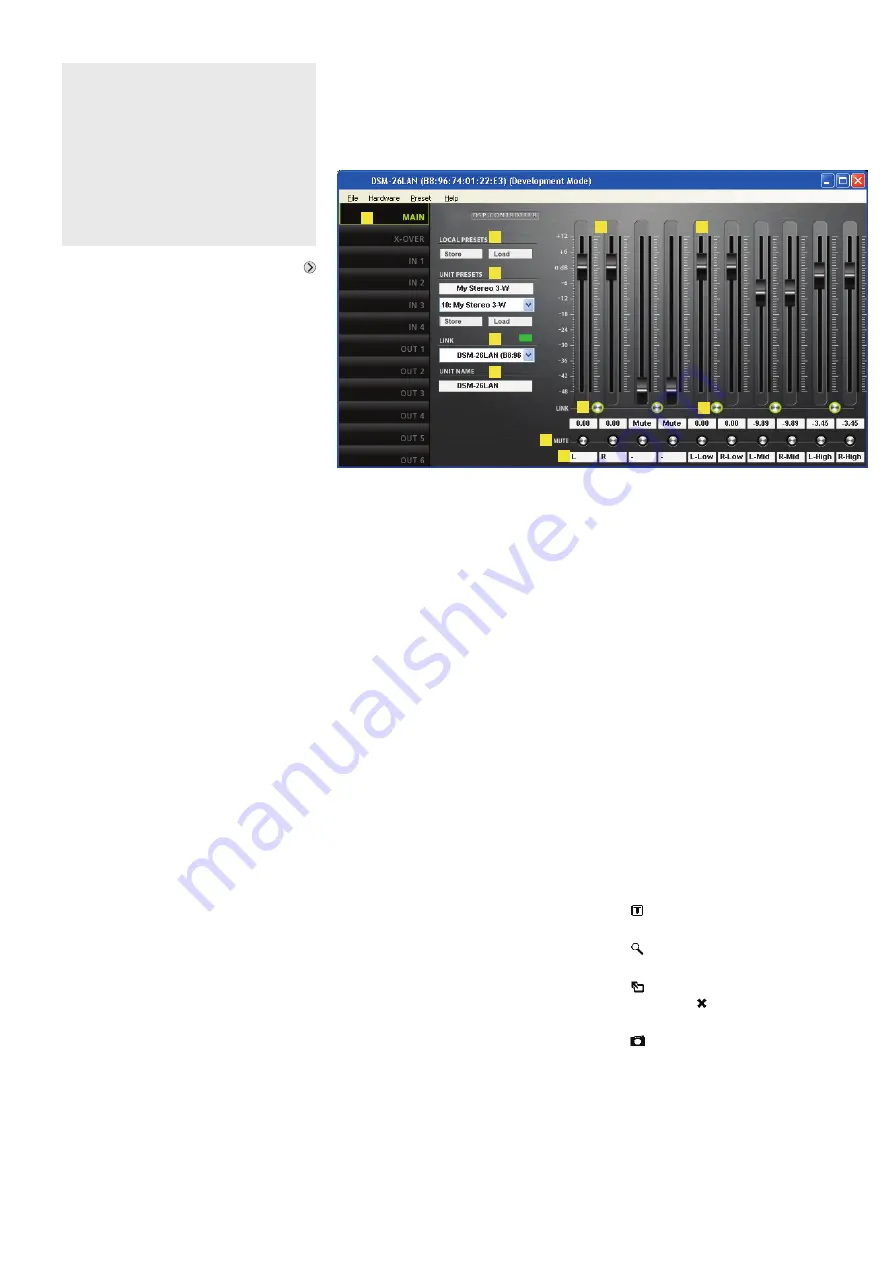
The configuration window (fig. 8) with
the view MAIN for the unit selected will
appear. The colour field on the left-hand
side, next to LINK
, will indicate the con-
nection status of the unit. When the colour
field is green, a data connection has been
established. A red field will indicate that the
connection has been interrupted and that it
is not possible to modify settings. If the user
tries to make changes, an error message
will appear.
Any settings changed on the screen will
be instantly transferred to the unit provided
that a data connection exists. The settings
can be saved as presets on the computer
and the unit (
chapter 2.3.2). In addition,
it will be possible to define if the unit, when
being switched on, is to load a specific pre-
set or the state it was in when switched off
(
chapter 2.3.10).
To go to the other views (X-OVER,
IN 1 – 2/4, OUT 1 – 6/8 (figs 9 – 11), use the
buttons on the side bar. To return to the
main view, click the button MAIN.
2.3.1 Signal path
Figure 3 shows a block diagram of the path
a signal takes through the DSM-26/48LAN.
Starting at the inputs, the signals, after
analog/digital conversion (alternatively, the
signal of the digital input AES/EBU can be
selected in the inputs A and B), pass the
input amplifier (GAIN), a high pass filter
(HPF), a low pass filter (LPF), the 10-band
sound adjustment (PEQ), the signal delay
(DELAY), a dynamic range compressor
(COMPRESSOR) and the level limiter
(LIMITER). For each of the output
channels, a mixed signal can be created
from the inputs signals processed. This
mixed signal will pass a high pass filter
(HPF), a low pass filter (LPF), a 10-band
sound adjustment (PEQ), a signal delay
(DELAY), a dynamic range compres-
sor (COMPRESSOR), a level limiter
(LIMITER), the phase inversion option
(PHASE INVERT), the digital/analog con-
version and will then be routed to the
outputs.
Attention!
Combined with the control program, the
signal processor is an effective tool for
making very detailed but also major
changes to the transmission properties of
the PA system.
Therefore, each modification to the
parameters should be performed with
care and expertise. At the worst, extreme
changes to the settings may damage the
speakers.
⑧
View MAIN
2.3.2 View MAIN
(fig. 8)
Buttons to go to a different view
LOCAL PRESETS
To save (“Store”) the current settings as
presets on the computer (like the menu
item “File
±
Save”) and to load them from
the computer (like the menu item “File
±
Open”).
UNIT PRESETS
To save (“Store”) the current settings as
presets on the unit and to load a preset
that is saved on the unit
Select the storage location from the list
field and enter a name in the upper field.
LINK – connection status
Green = connected
Red = not connected
To change to a different unit, select the
unit from the list.
UNIT NAME – name of the unit; over-
write the name to change it
Control GAIN to adjust the volume of the
inputs; the level indicators are next to
the control; the input/indication fields for
the gain value are beneath the control
Control GAIN to adjust the volume of the
outputs; the level indicators are next to
the control; the input/indication fields for
the gain value are beneath the control
Switch LINK to link the inputs (in pairs)
Switch LINK to link the outputs (in pairs)
Switch MUTE to mute the correspond-
ing input or output
Input fields to name the inputs and out-
puts
2.3.3 View IN 1 – 2/4
(fig. 9)
Buttons to go to a different view
Curve diagram of the magnitude fre-
quency response
Each of the 10 parametric filters has a
point of reference (small square with fil-
ter number) and a frequency curve in a
specific colour. The frequency response
resulting from all active filters is repre-
sented by a white curve.
Some of the filter parameters can also
be set graphically. To do so, move the
corresponding point of reference with
the mouse:
– move horizontally to change the fre-
quency
– move vertically to change the gain
– move horizontally with the right mouse
button to change the quality factor/
bandwidth
– double-click a point of reference to
switch the corresponding filter on or off
to show/hide the values of all active
filters
to switch the fine-adjustment mode
on and off
to enlarge the display
⇒
full-screen
mode;
to return to the reduced
size mode
to save curves as image files (PNG)
Control GAIN to adjust the volume of the
corresponding input; the level indicator
is next to the control; the input/indication
field for the gain value is beneath the
control (same effect as
)
The parameters for the blocks shown
can be set in the views MAIN, X-OVER,
IN 1 – 2/4 and OUT 1 – 6/8. Some of the
parameters can be accessed via various
views.
Note:
The setting options available depend on the
access rights of the current access level (
chap-
ter 1). To be able to make all settings, go to the
access level “Development” when calling up the
control program for the first time. This level allows
you to define the access rights and passwords for
the other access levels as required by the users
who will operate the unit (
chapter 2.3.7).


