


PICDEM Touch Sense 2 Demo Board User’s Guide
DS51748A-page 14
©
2008 Microchip Technology Inc.
3.2.1
The Board Window
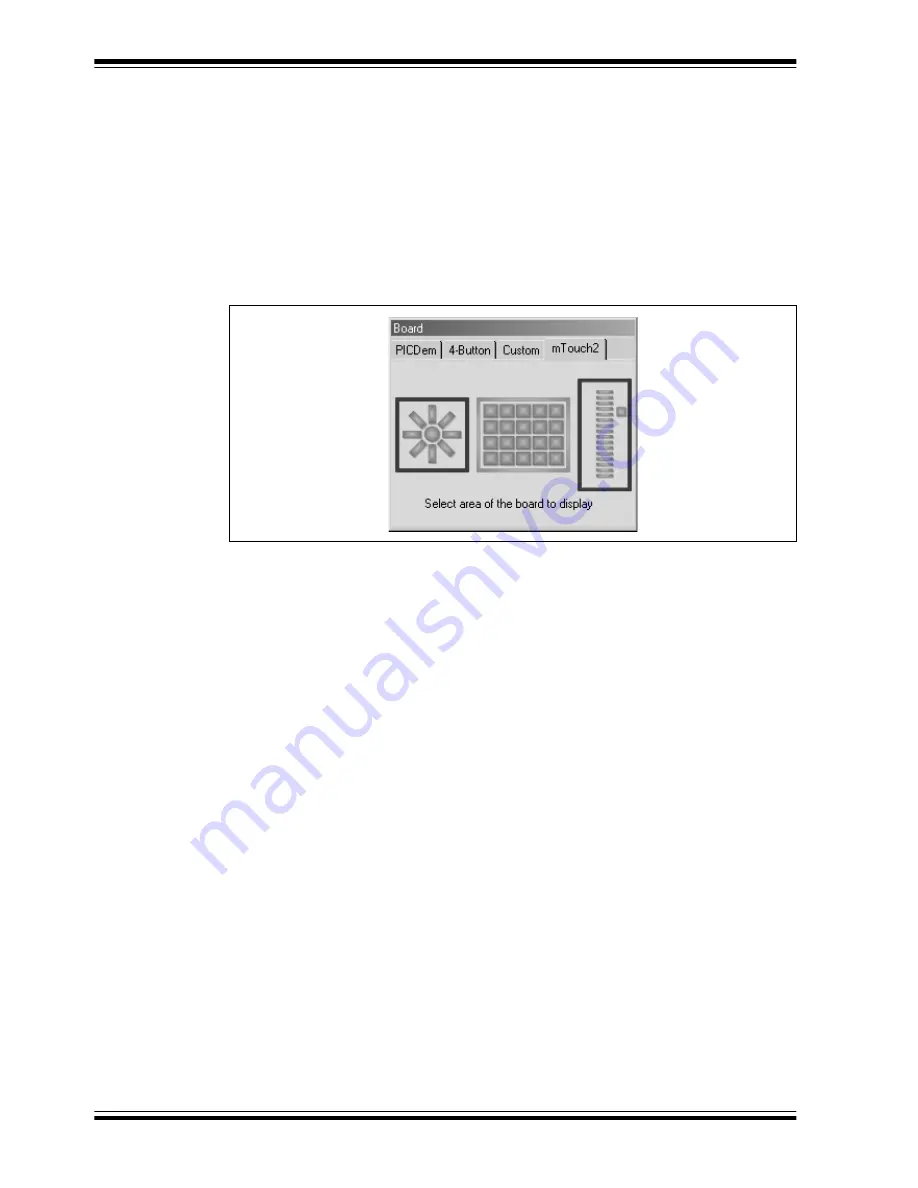
The smaller of the two windows is the Board window. This window is used to select the
Microchip hardware application to be used with the diagnostic tool, and which
subsystem is to be examined.
By default, the application starts up configured for Microchip’s PICDEM Touch Sense
1 Demo Board (
PICDem
tab). To configure for the Touch Sense 2 Demo Board, select
the
mTouch sensing solution
2
tab (Figure 3-2), then select one of the three areas of
the board for diagnostic testing by clicking on the appropriate graphic.
FIGURE 3-2:
THE BOARD WINDOW (mTOUCH™ SENSING SOLUTION 2
TAB SHOWN)
3.2.2
The Diagnostic Tool Window
The larger window is used to display the status of the individual sensors or channels
for the hardware and subsystem selected in the Board window. When the application
is configured for the Touch Sense 2 Demo Board, the Diagnostic Tool window changes.
Depending on the sensor area selected, the board shows status displays
corresponding to the number of sensor channels used for that area. Figure 3-3 shows
the window for the numeric keypad, with displays for the 4 rows (R1 through R4) and 5
columns (C1 through C5). When the directional keypad is selected, four status displays
are shown (north, south, east and west). For the touch slide sensor, three displays are
shown (top, bottom and power). An indicator, labelled “Board”, is also provided; this
shows a successful connection to the board.
The status display for each of the sensors takes the form of a bar graph. Above each bar
graph display is an indicator; this lights up (changes from dark green to light green) when
the software detects a touch event. The bar graph shows the sensor’s current state in
terms of the A/D conversion value of its channel. Values shown are scaled to a range of
0 to 65,535 and are dimensionless. Each bar graph has the following information:
• A constantly moving vertical bar that indicates the instantaneous conversion value
• An orange horizontal indicator across the bar that indicates the moving average of
the touch sensor
• A dark blue horizontal indicator showing the hysteresis value for the touch sensor
(the level the sensor must return to after an active or pressed level to change state
to inactive or unpressed)
• A light green horizontal indicator that shows the trip level that the touch channel
must reach to become pressed or activated.
• The average and raw conversion values, displayed numerically at the bottom of
the bar graph
A color key for the indicators is provided at the top of the Diagnostic Tool window.
Содержание PICDEM Touch Sense 2
Страница 1: ...2008 Microchip Technology Inc DS51748A PICDEM Touch Sense 2 Demo Board User s Guide...
Страница 4: ...PICDEM Touch Sense 2 Demo Board User s Guide DS51748A page iv 2008 Microchip Technology Inc NOTES...
Страница 10: ...PICDEM Touch Sense 2 Demo Board User s Guide DS51748A page 6 2008 Microchip Technology Inc NOTES...
Страница 14: ...PICDEM Touch Sense 2 Demo Board User s Guide DS51748A page 10 2008 Microchip Technology Inc NOTES...
Страница 28: ...PICDEM Touch Sense 2 Demo Board User s Guide DS51748A page 24 2008 Microchip Technology Inc NOTES...


