

Autolab/Electronic load combination
46 |
P a g e
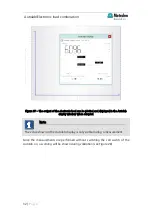
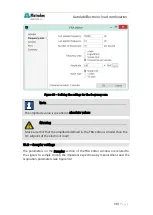
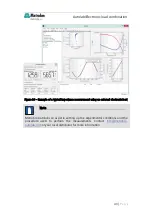
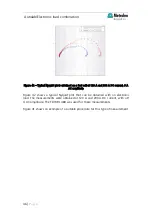
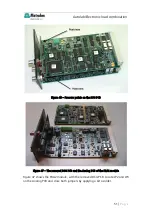
Figure 42 – Typical Nyquist plots obtained on a fuel cell at 120 A and 200 A DC current, 9 A
AC amplitude
Figure 42 shows a typical Nyquist plot that can be obtained with an electronic
load. The measurements were obtained at 120 A and 200 A DC current, with a 9
A AC amplitude. The TDI RBL 488 was used for these measurements.
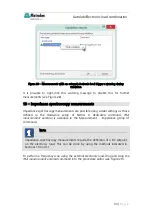
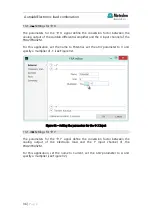
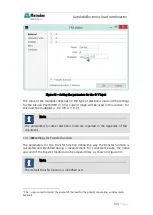
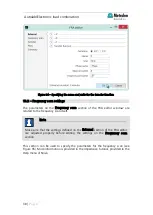
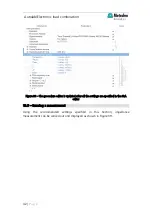
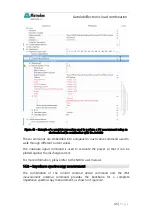
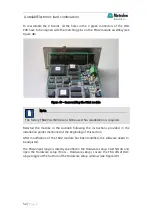
Figure 41 shows an example of a suitable procedure for this type of measurement.