

26
SYSTEM
Assume only
t
needs to be done and
S
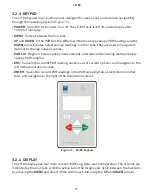
needs to be measured above the crop canopy. Level the
LP-80 above the canopy and press
UP. The reading displayed in the upper right portion of the
screen is the value for
S
.
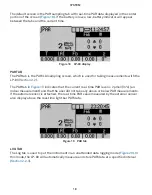
Measure
T
by placing the LP-80 below the plant canopy. Carefully place it below all of the
leaves and keep the instrument level. Press
DOWN. The resulting values are displayed
below the above-canopy values on the screen. Since the light below the canopy is extremely
variable, several samples at different locations will be necessary for a reliable reading. The
number of necessary samples can be determined by taking, for example, ten individual
readings and computing the coefficient of variation (
CV
.
Equation 9
=
CV
s
T
where
s
is the standard deviation of the 10 readings:
Equation 10
∑
=
−
−
s
T T
n
(
)
1
i
2
where
n
is the number of samples taken. The fractional error in the measurement of
T
will be
CV
divided by the square root of the number of samples.
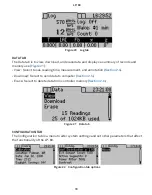
After the first below-canopy PAR measurement, the current
τ
value will displayed in the
lower left corner of the screen. With each subsequent below-canopy measurement, the
τ
value will be updated. After sufficient measurements, use the displayed
τ
value in the lower
left corner for
t
(
).
To find
r
(
), level the LP-80 above the canopy and press
UP. Then invert the
LP-80 at a height of 1 or 2 m above the crop canopy. Leveling is not critical for this
measurement since the radiation reaching the sensor is not directional. Press
DOWN in
the PAR sampling tab. Multiple readings are typically not necessary, since
R
is not usually
variable.
r
for
is shown in the
T
location at the bottom of the LP-80 screen.
To find
r
s
, invert the LP-80 over the soil below the canopy and take measurements at several
locations. Average and store these measurements as before. This reading is the value
U
. Calculate
r
s
from
U
and
t
. A value in the range of 0.1 to 0.2 should be
obtained, but it is possible that the light level below the canopy will be so low that
U
will
not be accurately measured. If a value outside of the expected range is obtained, there will
be negligible error in
f
by assuming
r
= 0.15. As mentioned before, evaluation of intercepted
radiation normally involves the measurement of
t
.
Only measurements below the canopy have been discussed. Obviously, measurements
throughout the canopy are possible. Profiles of interception with height can be useful in
determining at what location most of the photosynthesis occurs in the canopy.


