Navigational page layout
Version 6.03, May 2017
Page 161 of 192
6.3.24
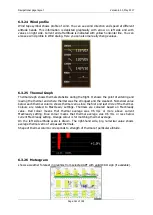
Wind profile
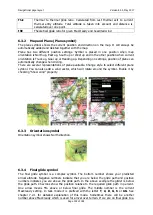
Wind tape symbol shows profile of wind. You can see wind direction and speed at different
altitude bands. This information is depicted graphically with arrow on left side and with
values on right side. Current aircraft altitude is indicated with yellow horizontal line. You can
also see wind profile in Wind dialog. Here you can also manually change values.
6.3.25
Thermal Graph
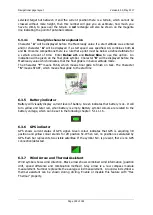
Thermal Graph shows thermals statistics during the flight. It shows the point of entering and
leaving the thermal and where thermal was the strongest and the weakest. Numerical value
below each thermal column shows thermal vario since the first and last circle of the thermal.
Colours are related to MacCready settings. Thermals are coloured based on MacCready
value. Red colour means that thermal average was 0.5 m/s or more above current
MacCready setting. Blue colour means that thermal average was 0.5 m/s or less below
current MacCready setting. Orange colour is for matching thermal average.
On the left side altitude scale is drawn. The right-hand side, big numerical value shows
average thermal vario of all passed thermals.
Shape of thermal column corresponds to strength of thermal at particular altitude.
6.3.26
Meteogram
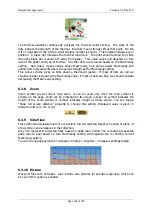
shows a weather forecast in graphics from selected APT with valid ICAO sign (if available).

