28
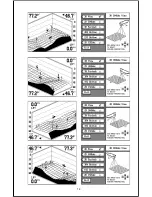
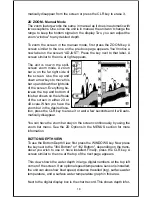
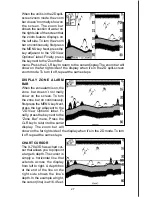
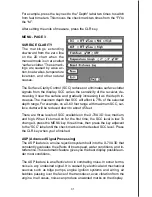
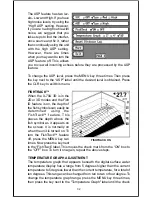
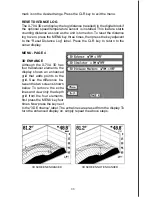
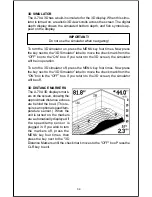
To display the chart cursor, press the MENU key. Next, press the key
adjacent to the “2D View Options” label. Finally, press the key next to the
“Chart Cursor” menu. Press the CLR key to return to the sonar display.
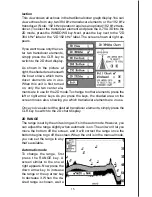
Use the up or down arrow keys to move the cursor up or down to the
desired depth.
To turn the chart cursor off, repeat the above steps. The unit returns to the
sonar screen without the chart cursor.
MENU - PAGE 2
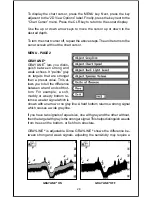
GRAYLINE
®
GRAYLINE
®
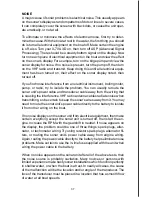
lets you distin-
guish between strong and
weak echoes. It “paints” gray
on targets that are stronger
than a preset value. This al-
lows you to tell the difference
between a hard and soft bot-
tom. For example, a soft,
muddy or weedy bottom re-
turns a weaker signal which is
shown with a narrow or no gray line. A hard bottom returns a strong signal
which causes a wide gray line.
If you have two signals of equal size, one with gray and the other without,
then the target with gray is the stronger signal. This helps distinguish weeds
from trees on the bottom, or fish from structure.
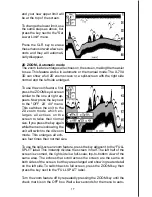
GRAYLINE
®
is adjustable. Since GRAYLINE
®
shows the difference be-
tween strong and weak signals, adjusting the sensitivity may require a
GRAYLINE
®
ON
GRAYLINE
®
OFF
Содержание ION AND OPERATION INSTRUCTIONS
Страница 16: ...14 ...

