


A__madi4 User Guide
Version: 10.0.0/4
29/68
12. The RAVENNA Web UI
3
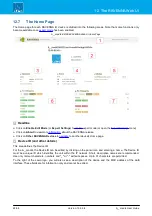
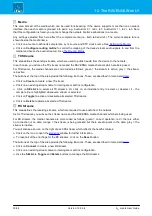
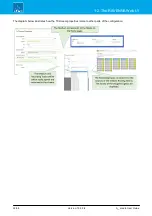
Network
This area defines the network settings of the streaming ports.
If the device supports SMPTE 2022-7 (streaming redundancy), then the ports are grouped into their SPS pairs.
For example: strm0 = ra0 + ra1. Note that the group and port names are fixed and cannot be changed.
For the A__madi4, the IP Address, Network Mask and Gateway of each streaming port must be edited using the
Web UI. Note that these settings are separate from the service network IP settings which are shown on the
page. Note that ra1 (ETHERNET B) will not be active until the RAVENNA to/from MADI (raw)
conversion mode is enabled.
The horizontal bar beside the group name is the Link Load indicator. Once streams are active, this indicates the
amount of streaming traffic. The indicator will change from green to orange and then to red.
Ø
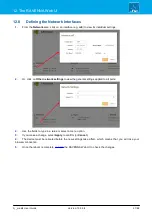
Click on an interface (e.g.
ra0
) to view or edit its individual
Ø
Click on
Other network settings
to view or edit the
applied to all ports.
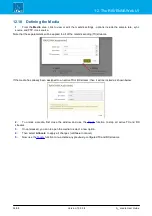
4
Sync
This area shows the status of the PTP clock source. What you see will vary slightly depending on the device's
: master-slave or slave only:
Master-Slave (device running as PTP Master):
·
Beside
ID
you will see the MAC address of the device. Hover your mouse over the MAC address to reveal
its IP address.
·
The text "
Master
" indicates the interface(s) which are transmitting PTP to the network.
Slave only:
·
Beside
GM
you will see the MAC address of the current grandmaster device. Hover your mouse over the
MAC address to reveal its IP address.
·
Beside each streaming interface, you will see
passive
if the interface is inactive, or
Slave
if the interface
is active and operating in Slave only mode. On the A__madi4, you will also see
Disabled
if the ra1
interface is not activated.
·
You will also see the amount of
path delay
, otherwise known as the differential delay. This is the delay
caused by the time it takes the packets to travel between the PTP master and slave device.
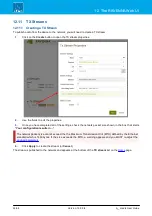
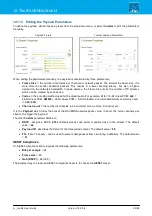
The graphical area monitors the PTP clock source over time:
PTP Signal OK
PTP Signal in error
The graph should be green if the device is receiving or transmitting a valid PTP signal. The graph will change to
orange or red if there is a problem with the PTP signal. Hover your mouse over the graph to reveal further
information.
Ø
Click on
PTP
to view or edit the
for the device.