75
Spectrum View
Spectrum View
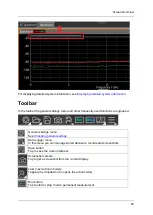
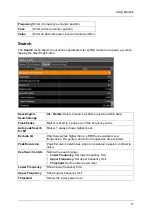
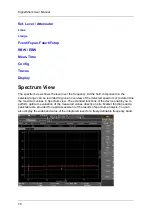
The spectrum view shows the level over the frequency. All the field components in the
selected range can be recorded to give an overview of the detected spectrum or to determine
the maximum values in Spectrum view. The extended functions of the device enable you to
perform optimum evaluation of the measured values directly on site. Marker functions and a
peak table are provided for rapid assessment of the results of spectrum analysis. You can
also display the wideband value of the integrated level for a freely-definable frequency band.
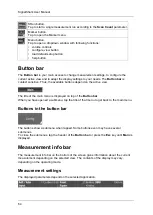
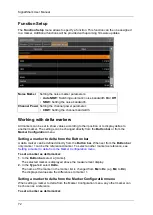
Available Buttons
For information about the different types of buttons and how to select them see
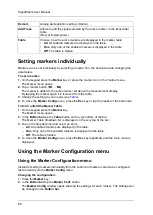
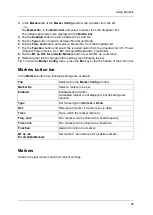
Tap a button to change setting or to open the submenu.
Содержание Narda SignalShark
Страница 1: ...User Manual Version 2019 07 ...
Страница 2: ......
Страница 14: ......
Страница 15: ...15 Online Help Version 2019 07 ...
Страница 16: ......
Страница 31: ...Introduction 31 Figure Loop antenna frequency range 9 kHz to 30 MHz ...
Страница 32: ......
Страница 38: ......
Страница 44: ......
Страница 60: ......
Страница 66: ......
Страница 74: ......
Страница 88: ......
Страница 104: ......
Страница 118: ......
Страница 132: ......
Страница 158: ......
Страница 198: ......
Страница 204: ......
Страница 214: ......
Страница 226: ......


