


42
JPK Instruments NanoWizard
®
Handbook Version 2.2
The method is most suited to soft cantilevers, where the free fluctuations are more
significant, and where other methods have significant problems. This is typical for
the case of single molecule or single cell force measurements.
Thermal vibrations
The energy in the cantilever vibrations comes from the natural thermal environment
of the cantilever, for instance at room temperature or physiological temperature.
The fluctuations is measured by the AFM system as vertical deflection against time,
and in theory, the data could be analyzed as a histogram of vertical deflection
values. However, the low-frequency components would dominate over longer
times, for instance because of cantilever deflection drift. Therefore, the
measurements are analyzed by looking at the frequency dependence of the
fluctuations. This allows a more focused analysis of the data at the actual cantilever
resonance, so that low frequencies or specific noise sources are excluded.
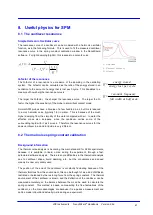
A simple harmonic oscillator fit is made to the resonance peak (free fluctuations
plotted against frequency), and the area under the curve is used as a measure of
the energy in the resonance. Equipartition theory says that the energy in any free
mode of the system has to be equal to the thermal energy due to the absolute
temperature of the system, ½ k
B
T, where k
B
is the Boltzmann constant (not related
to the spring constant!). The measured energy in the is given by the spring
constant and the average value of the vertical deflection of the cantilever, here q.
T
k
E
B
Thermal
2
1
=
2
2
1
2
1
q
k
T
k
B
=
The value of q
2
is what is measured from the fit to the frequency spectrum. This
assumes, however, that the movement of the cantilever is completely harmonic. In
fact, there are various correction factors that are needed to get a more accurate
value from the fit. The online SPM software from JPK Instruments is equipped with
automatic thermal noise analysis for cantilever calibration, several corrections are
included and there is space for user input of specific correction factors, depending
on the type of cantilever and resonance peak.
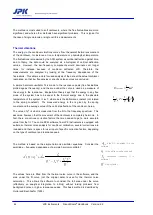
The method is based on the simple harmonic oscillator equations. Consider the
amplitude – frequency dependence of a simple harmonic oscillator:
2
2
2
0
2
2
0
2
4
0
2
2
2
)
(
)
(
Q
f
f
f
f
f
A
f
A
DC
+
−
+
=
η
DC
A
is the D.C. amplitude (A in the
software)
η
is the white noise background
0
f
resonance frequency (f in
software)
Q
Quality factor
The values here are fitted from the thermal noise curve in the software, and the
area under the fit curve (not the original data) is used for the thermal noise
calculation. This allows the software to consider the full area under the curve
(effectively an analytical integration to infinity) without raising problems from
background noise or higher resonance peaks. This basic method is described by
Hutter and Bechhoefer (1993).


