


P 1000, 2000, 3000 & 5000 Ex
Ion Science Ltd
Page 14 of 41
Zone
Instrument Menu
_____
In the Tools Menu use the UP and DOWN keys to find the function you require. To select the function, press
the ENTER key.
Data Logging, Zones & Files (P 2000, 3000 & 5000)
P
automatically data log the instruments readings every second. These readings are stored in the
instrument's memory with a date and time stamp. The instrument has been designed to continuously store
data; once the memory has reached its full capacity (8 Mb) it will automatically begin to overwrite previous
readings. An alarm can be set (see page 16) to inform the user that this is due to happen, giving time to
download any data that may be over written.
Stored data can be viewed on the P instrument or it can be downloaded to a PC for analysis and
to be archived. Ion Science recommends downloading saved readings once a week.
In some applications readings need to be recorded in many different locations leading to many hundreds of
stored files. P was designed with these requirements in mind and has the facility to store files into
ZONES. The P has a default Zone called Zone 0 (which can not be deleted), unless specified all
readings will automatically be stored under this Zone. The P has an additional 199 Zones which
the user can name themselves, either direct via the instrument or by using the IonPC software.
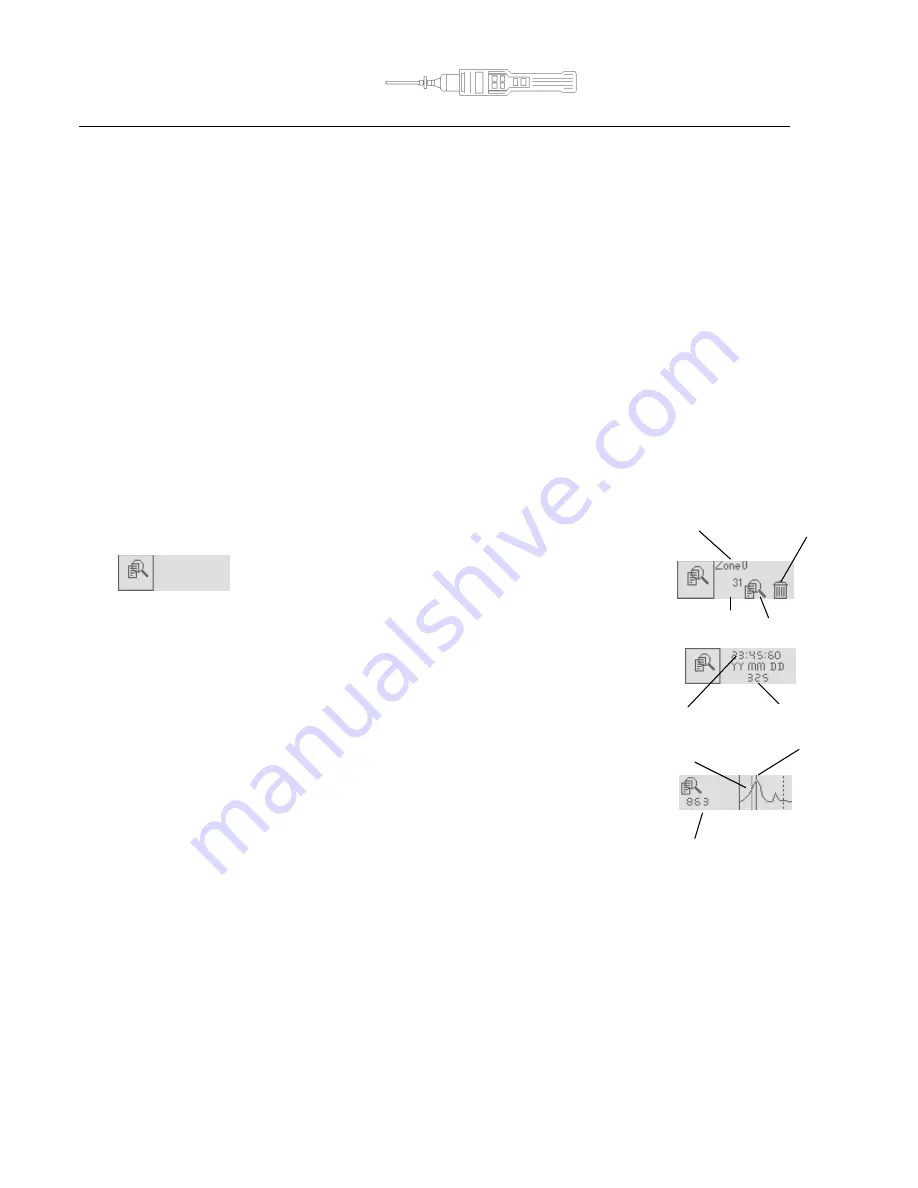
View Data (P 2000, 3000 & 5000)
This function allows the stored data to be viewed or deleted
First select the Zone of interest by moving the cursor using the
UP and DOWN keys, press ENTER to select it.
Then select the required File in the same way. Now select the View Data symbol,
this will show the first reading logged with a date and time stamp
and the number of logged readings within the selected file.
To view the stored data in a graphical form press the ENTER key.
A graph representing the stored readings within the selected file
will be displayed.
The flashing cursor can be moved along the graph
to a reading of interest.
When the cursor stops the reading will be displayed in the units selected,
press the ENTER key to see the date and time stamp of that reading if required.
The Alarm Indicator dotted line is present on a graph to show that this is the exact
point at which an alarm was set off. The instrument will continue to alarm until the
alarm is acknowledged by the user by pressing the ENTER key, this is shown on the
graph as a dashed line (Alarm acknowledgement).
Delete
Date/Time
Number of logged
readings
Reading
Alarm Indicator
Cursor
View Data
File


