1 Introduction
1 Introduction
The Intona Ethernet Debugger is a device to capture packets between two Gigabit Ethernet devices. It
provides two ethernet ports, and each port forwards all traffic to the other port, as well as to a PC con-
nected via USB. The intended purpose is low level debugging of anything above the ethernet physical
layer, mainly using Wireshark and similar protocol analyzers. It helps when developing your own proto-
cols layered on top of ethernet, developing your own MAC, or just for observing what is going on on your
network.
1.1 Features
This device can log complete ethernet packets as received by the PHY. There is no processing of captured
packets – preamble, SFD, and FCS are all left intact. Packets with incorrect CRC sums are not discarded.
Ethernet packets which violate the specification are captured as far it is possible. Some normally invisible
low level details are explicitly logged, such as interpacket gaps and CRC errors. Jumbo frames (ethernet
packets longer than 1500 bytes) are supported and fully captured up to 16KB size.
Capture output is directly streamed to the PC. There is no kernel device driver. The device is accessed
through a libusb userspace driver. You do not necessarily need elevated privileges. Installing the device
will not destabilize your system. In particular, the device is not exposed as network device. This has the
advantage that your OS will not mess with it. Neither will it attempt to drop or filter packets received
through it, nor will it attempt to send random packets to it (ARP etc.). The latter would show up in
Wireshark, and confuse your development efforts.
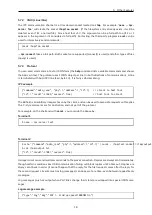
Capture can be directly started from Wireshark (if installed correctly). The userspace driver also provides
a command line interface, which can be used to access advanced feature. An IPC interface is provided
for use cases like scripting.
The debugger can block packets in one or both directions, corrupt packets, inject new packets. This is
interesting for development and security research. (For example, you can test resilience of your ethernet
connected device or software against random packet drops, test its behavior on flooding, or implement a
network stack fuzzer.)
There are many other features. See Other features section.
1.2 Requirements
The software works on Windows, Linux, and macOS. We provide an installer for Windows. Windows 10
64 bit is required, but Windows 7 may work as well. For macOS, a homebrew tap is provided
. For Linux,
source code and build instructions are provided
, which should work on any Linux distro.
USB 3.0 or later host and cable are recommended. USB 2.0 may work in low bandwidth scenarios. Us-
ing an USB hub, and/or connecting multiple USB devices to an USB hub/host may reduce the maximum
bandwidth at which capture is possible without capture overflows.
1.3 Restrictions
Ethernet is intercepted by putting two PHYs between the two ports. There is no direct connection between
the ethernet TX/RX wires of the ports. Each PHY negotiates the ethernet connection separately. No link
can be established without USB power.
1
https://github.com/intona/homebrew-ethernet-debugger
2
https://github.com/intona/ethernet-debugger#build-instructions
4


