FlashSystem 900 Product Guide
19
Performance menu overview
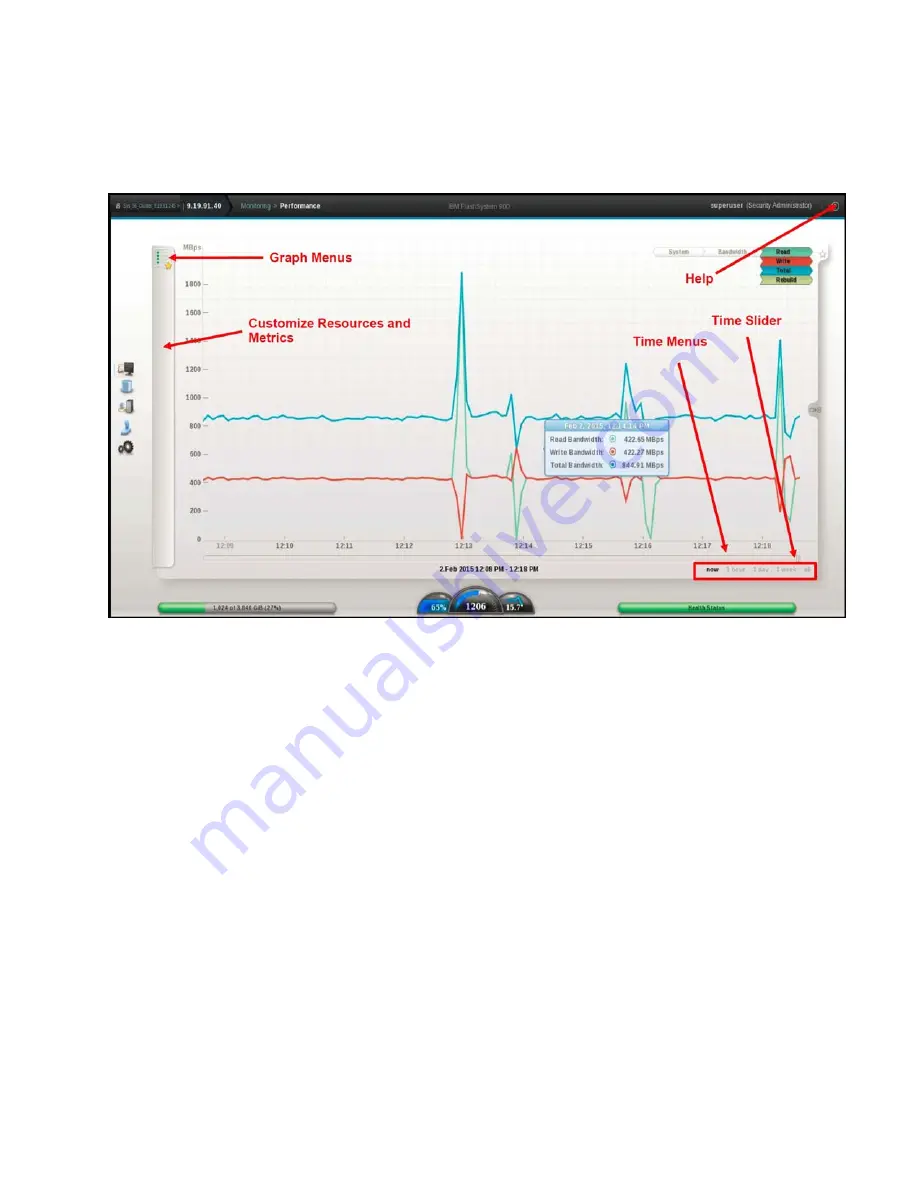
Enter the FlashSystem 900 performance monitor by clicking Monitoring -> Performance. The first time
after the browser window is opened, system latency is displayed as shown in Figure 9.
Figure 9. Improved GUI - Performance monitoring window
The horizontal part of the graph displays the timeline. You can slide the timeline to view the past. You can
also adjust the granularity of the timeline by selecting one hour, one day, one week, one month, or all.
"All" displays the year to date.
Five performance charts can be reviewed from the graphs menu:
System IO:
z
The System I/O graph displays the average number of read, write, and total I/O operations per
second (IOPS) over the sample period. Each request type (read, write, and total) is represented by a
different color line.
System Latency:
z
The System Latency graph displays the average amount of time in milliseconds (ms) read and write
I/O requests take over the given sampling period. Each request type (read and write) is represented
by a different color line.
System Bandwidth:
z
The System Bandwidth graph displays the average number of megabytes per second (MBps) of read,
write, total, and rebuild bandwidth over the sample period. Each bandwidth type (read, write, total,
and rebuild) is represented by a different color line. There is one line graph for each system that is
selected.


