Data Recording and Playback
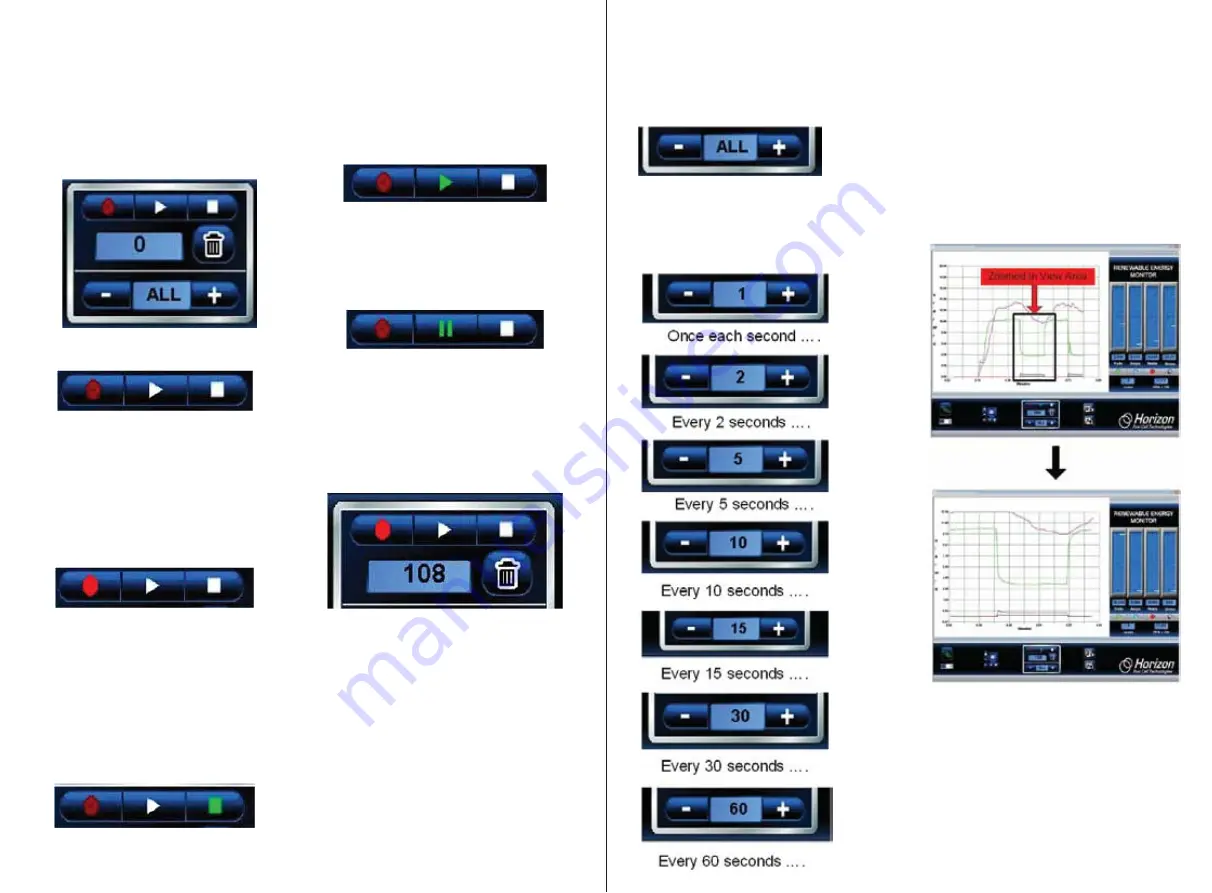
The built in recording feature is like recording
a TV show for later playback except that you’re
using data coming from the
Renewable Energy
Monito
r instead. The Recording and Playback
controls are shown here.
The top three controls are…
Record Play – Pause Stop
Recording Data
Click the (round) Record icon to start recording
data. The icon will change to a brighter red
color.
Stop Recording
Click the (square) Stop icon when you’re done
recording. The Stop icon will momentarily
change color from white to green – then back to
white again. The red Recording icon will also
turn off and the plot will go back to real time.
Play and Pause
Click the (triangle) Play icon to begin
replaying the recorded data. The Play
icon will change from white to green during
playback.
You can Pause the playback by clicking again
on the (triangle) Play icon. It will change from
a green triangle to a green double line. Click
the Pause icon again to resume playback.
Recording Counter
The Recording Counter indicates the number
of data samples that are (or have been)
recorded for later playback. It can range from
1 to 999.
The Trash Icon
Click the Trash icon to erase all the recorded
data. This will also reset the time on the plot
area back to 0.0 minutes. You can push the
Trash icon anytime; just make sure you really
want to erase all the recorded data.
Sample Rate
You can control the rate at which you sample
data by clicking the + or – icons on the Sample
Rate indicator.
The default is ALL which means that all
data from the Renewable Energy Monitor is
recorded. Clicking the minus icon will slow
the sample rate to the following:
Zooming
While plotting data in real time or replaying
data after recording, you can zoom in on
a portion of the data at anytime. Simply
position the mouse cursor over the area
you want to zoom in to and click the left
mouse button. Then release the left
.
e
r
u
t
a
e
f
m
o
o
z
e
h
t
e
t
u
c
e
x
e
o
t
n
o
tt
u
b
e
s
u
o
m
69
70


