PROCESS INFORMATION DISPLAYS
6510020335
115
6.2.4
Graphs
When you click on the
Graph
button
, it opens the Graph Selection
dialog box, where user can select the additional statistical data graphs and the previous
graph.
Fig. 93.
Graph Selection
6.2.5
Allow New Data
The
display updates whenever new data become available. This
display can be disabled by selecting the checkbox present next to the display.
6.2.6
2-D Cursors
A 2-D cursor allows you to select the rows and columns. The right graph shows the values
for the selected column and the bottom graph shows the values for the selected row. Click
or drag the cursor to any location in the graph to view the profiles and statistics at a
specific time or cross-directional position. You can also use the arrow buttons to the left of
the plot to move the cursor.
Fig. 94.
2D-Cursor
6.2.7
History Selection
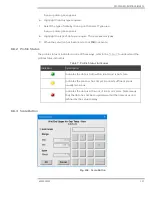
The data that are generated in a particular period can be retrieved by entering the time in
the QCS History selection dialog box.
Содержание Experion MX
Страница 1: ...Experion MX RELEASE 702 1 Operators Guide 6510020335 Rev 02 May 2019 ...
Страница 7: ...6510020335 7 8 NOTICES 168 ...
Страница 20: ...SCANNER SAFETY AND LOCAL CONTROLS 6510020335 20 Fig 15 Cable End Voltage Zones ...
Страница 21: ...SCANNER SAFETY AND LOCAL CONTROLS 6510020335 21 Fig 16 Distant End Voltage Zones ...
Страница 124: ...PROCESS INFORMATION DISPLAYS 6510020335 124 Fig 105 Profile Display ...
Страница 159: ...PROCESS INFORMATION DISPLAYS 6510020335 159 Fig 148 Precision Platform 4000 01 Scanner ...
Страница 160: ...PROCESS INFORMATION DISPLAYS 6510020335 160 Fig 149 Precision Platform 4000 20 21 Scanner ...


